

Understanding the Scientific Method and the Reality of Climate Change
A previous article described how our warming climate, also called “climate change,” is affecting New Mexico’s and other global water supplies.[1] Yet, some claim that climate change is not really happening, that it is a liberal hoax. However, most of those in the scientific and environmental communities say these global climate changes are indeed real and increasingly threatening life around our planet. What is the truth?
Here, it is important to understand that scientists using statistical methods can readily conclude that certain relationships are false, but statistical methods cannot prove that an alternative relationship is true with complete certainty. Instead, scientists assess important conditions that might cause or contribute to a suspected relationship, including using models addressing the possible cause-and-effect relationships (essentially, evaluating alternative assumptions).
By rigorously evaluating these different variables, scientists strive to determine whether a suspected link is truly causal or merely coincidental. This careful, evidence-based approach allows researchers to refine their understanding and minimize uncertainty in their conclusions. Even so, the remaining margin of doubt—often a mere 1% to 5%—is sometimes exploited by those seeking to undermine established scientific findings. Ultimately, the strength of the scientific method lies in its ability to recognize complexity, test alternatives, and continually improve our grasp of reality.
Also, when appropriate for the relationship in question, they assess any change in patterns of multiple health or environmental indicators. All of this leads to a “weight-of-evidence” conclusion that the stated link between cause and effect is real. In this example, climate warming and change are happening and are caused by emissions.
The typical 1% to 5% gap in absolute certainty that a relationship is real is routinely used by a small number of well-paid, industrial and politically sponsored “experts” to oppose strong scientific conclusions, such as tobacco smoking causes cancer, and emissions of carbon dioxide (CO2) and greenhouse gases cause climate warming and climate change. Then, too, there are those who just invent their own “facts,” independent of truth. Who should we believe? What does the research tell us?
To better understand the controls needed to limit and reverse climate warming, it is helpful to look at how scientific understanding of the interaction between CO₂ and solar heating in the atmosphere has developed. The following summary intends to help guide readers to meaningful answers about why our climate is warming. Indeed, the scientific understanding about climate warming and climate change has been assessed through environmental monitoring and modeling that has been conducted internationally for more than a century by hundreds, even thousands, of objective scientists.

When considering this summary, it is important to understand that “weather” refers to the temporary, short-term atmospheric events occurring around us. In contrast, “climate” reflects the longer-term atmospheric patterns that persist over seasons, years, or decades. [2] A drought is therefore considered a climatic phenomenon rather than a weather event, while desertification represents a more permanent shift in climate conditions, as our previous article described.
How long has it been known that carbon dioxide and other greenhouse gas emissions warm our atmosphere?
Much of the scientific research history is laid out in the book Fire Weather by John Vaillant.[3] The first portion of his book describes the personal experiences of many individuals involved in fighting and being impacted by the wildland-urban interface fire that started May 2016 in the climate-dried forest five miles outside of Fort McMurray, Alberta, Canada. That fire grew into a greater than 1000oF firestorm that consumed much of Fort McMurray and its surrounding communities. The fire he describes is somewhat similar in scale and scope to the extreme fires impacting New Mexico, Southern California, and other western states during 2023-2025.
Six Scientific Milestones
Horace Bénédict de Saussure (1774)
Demonstrates solar heat trapping with glass-covered “hot box.”Eunice Newton Foote (1856)
Shows CO₂ heats faster and retains heat longer than air.John Tyndall (1859)
Proves certain gases absorb infrared heat radiation.Svante Arrhenius (1896)
Calculates global warming from increased atmospheric CO₂.John Henry Poynting (1907)
Introduces the term “greenhouse effect” for atmospheric heat trapping.Charles David Keeling (1958)
Begins continuous CO₂ measurements revealing seasonal cycle and rise.
Then, Fire Weather’s chapter 19 starts Vaillant’s historical overview of the scientific understanding of how greenhouse gas emissions, particularly CO2, drive climate warming and climate change. The list below briefly summarizes his extensive overview of that history. The chronological narrative outlines how we now know that elevated atmospheric CO2 concentrations interact to produce climate warming that is progressively changing our planet’s atmospheric circulation and other climatic patterns.
- July 16, 1774 [4] – Horace Bénédict de Saussure, a natural philosopher from Geneva, built an insulated wooden box, closed at the top with layers of glass and a thermometer placed on its bottom. He carried the box to a peak on the Italian side of Mont Blanc where he exposed it to sunlight. At that elevation of about 9,000 feet the air was 43°F. After an hour’s exposure to the sun, the temperature in his box had risen to 190°F. From this and his similar findings at other elevations, he concluded that little heat is actually absorbed by the atmosphere from the incoming sun’s rays. Instead, the sun’s heat is absorbed by Earth’s surface and then re-emitted, heating the atmosphere from the bottom up.His findings became known as “the Saussure hot house theory.”
- August 23, 1856 – Earlier in 1856, Eunice Newton Foote filled one sealed gas cylinder with “ordinary air” from the room and a second with “carbonic acid gas” (that is CO2). Thermometers were inserted into both bottles. Inside the room both bottles were the same temperature. Then she exposed both bottles to sunlight outside. The air in the CO2-filled bottle heated twice as fast. Returning the bottles inside, the air in the CO2 filled bottle stayed warmer longer. On that date, a male colleague presented her results to the annual meeting of the American Association for the Advancement of Science with her concluding “glimpse into the future” that, “An atmosphere of that gas [CO2] would give our earth a higher temperature.”
- 1859 – In the earliest steps that led to increased CO2 in the atmosphere, “Colonel” Edwin Drake drilled his first oil well in Pennsylvania. Etienne Lenoir built a prototype of a commercially viable internal combustion engine. The Irish physicist John Tyndall presented to a meeting of the Royal Institution his confirmation that others had made over the previous century proving that concentration of “certain gases in our air” had the potential to trap solar energy and alter the Earth’s climate. Essentially, he described the greenhouse effect, yet to be named.
- 1896 – Henry Ford built his first car that year. Also, the Nobel Prize winning Swedish chemist Svante Arrhenius published his research on atmospheric warming and cooling due to changes in CO2 in the atmosphere. His detailed calculations, which were developed using earlier conclusions made by the geologist Arvid Högbom that industrial coal burning was warming the climate, indicated that a 50% increase in atmospheric CO2 from the 1890s levels would warm the Earth by 6 degrees Fahrenheit.
- 1901 – The meteorologist Nils Ekholm wrote that CO2 in, “The atmosphere may act like the glass of a green-house … letting through the light rays of the sun relatively easily, and absorbing a great part of dark rays [heat] emitted from the ground … [potentially raising] the mean temperature of the earth’s surface.”
- 1907 – The British physicist John Poynting, responding in an article to an earlier one written by the Boston-based travel writer and citizen scientist Percival Lovell, coined the concept term, “the ‘greenhouse effect’ of the atmosphere.”
- 1908 – In a significant step increasing the rate of atmospheric CO2 emissions, Henry Ford introduced his popular and widely purchased Model T. In the same year, Svante Arrhenius published the English edition of his “World in the Making: The Evolution of the Universe.” In it he wrote, “The enormous combustion of coal by our industrial establishments suffices to increase the percentages of carbon dioxide in the air to a perceptible degree.”
- 1938 – The Canadian born and British raised steam engineer and amateur meteorologist Guy Callendar published, “The Artificial Production of Carbon Dioxide and Its Influence on Climate” in a respected British meteorological journal. It was based on his hand analyses and plots of hundreds of years of temperature records from 200 weather stations around the globe. He concluded, in part, “Few … familiar with the natural heat exchanges of the atmosphere … [that cause] our climates and weather, would be prepared to admit that the activities of man could have any influence upon phenomena at so vast of scale. In the following paper I hope to show that such influence is not only possible, but is actually occurring at the present time.” His analysis of thousands of weather records showed that the mean global temperature had risen by 0.9oF from 1890 to 1935.
- 1956 – Canadian geophysicist Gilbert Plass used infrared spectroscopy to first challenge and subsequently reconfirm that long-wave, infrared solar heat is retained by water vapor and industrially emitted CO2 in the atmosphere. In his 1956 publication, Carbon Dioxide and Climate, Plass wrote, “virtually all known glaciers in both hemispheres have been retreating… There can be no doubt that this will become an increasingly serious problem as the level of industrial activity increases.” He emphasized that as the combustion of coal reserves continued to drive up atmospheric CO2concentrations, average global temperatures have the potential to increase “into uncharted territory.”
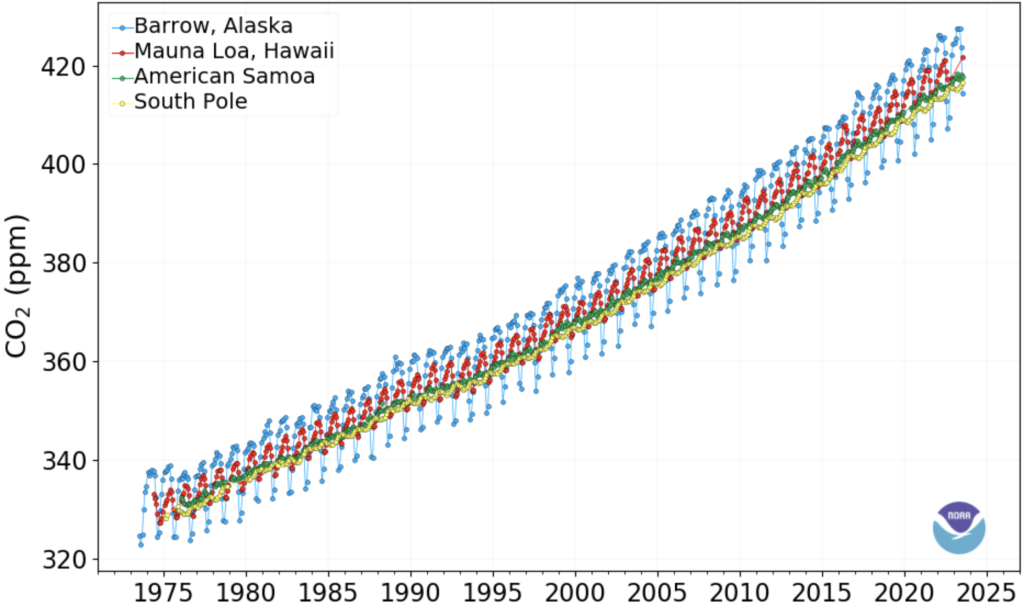
- 1958 – Mass spectrometer research starting in 1958, by the Scripps/Caltech geochemist Charles Keeling detected that atmospheric CO2 concentrations fell during the spring and summer months as plant photosynthesis increased. These CO2 concentrations then rose during the fall and winter months as plants became dormant. Keeling also found that the increasing annual trends for both atmospheric temperatures and CO2 concentrations matched (now called the Keeling Curve). Notably, his assessment of CO2 in ancient air from deep glacier ice indicated that the pre-industrial baseline atmospheric CO2 was approximately 280 parts per million (ppm), which started increasing in 1750 with coal-burning industrial development. By 1960, CO2 had increased to 315 ppm. In 2023 it had increased to 427 ppm (0.0427%), which is equivalent to 3,300 billion metric tons of CO2[5].
The Keeling Curve, Monthly CO2 Atmospheric Concentrations, NOAA Global Monitoring Laboratory
Vaillant emphasizes that Callendar was the first to document and chart how the Petrocene Age, as it is now sometimes called, was affecting climate. Vaillant also added that, while the term ‘Anthropocene’[6] had not been invented in Callendar’s time, he likely would have used it to characterize the period where humans have the dominating influence in affecting life on our planet. In our next article we continue the brief summary of Vaillant’s book’s description of how the political and popular perceptions of climate change and global warming have themselves changed.
Another Effect of CO2 Emissions: Water Acidification
As CO2 dissolves in water, including our oceans, it makes the water more acidic. Specifically, dissolving CO2 in water forms carbonic acid and in distilled water the resulting pH is 5.65. Water that is neither acidic nor basic has a pH of 7.0; a pH level of 5.65 means that the water is 22 times more acidic than the acid/base neutral condition. Fortunately, most of the Earth’s water has natural buffering, meaning it tends to resist increases in acid formation due to various minerals it has dissolved, particularly limestone.
Today, the changes in pH coupled with warming of water are causing the bleaching and death of major coral reefs, including the loss of their associated ecological communities of fish and other life forms. Concurrent changes are also occurring with other fish communities, whale populations, and many other populations of other species throughout our oceans. This CO₂-driven ocean acidification is compounded by ongoing sulfur dioxide and nitrogen dioxide emissions, which form sulfuric and nitric acids when fossil fuels-especially sulfurous coal and petroleum-are burned.

End Notes
[1] Marcus, M. 2025. New Mexico Drought, Aridification & Desertification. https://nmwateradvocates.org/new-mexicos-water-crisis-drought-aridification-desertification/
[2] The American Meteorological Society defines weather as the state of the atmosphere at a particular time and place, and climate as the statistical summary of weather over extended periods, typically decades. It defines drought as a “period of abnormally dry weather sufficiently long to cause a serious hydrologic imbalance,” placing it within the category of climate anomalies, not weather. Desertification and aridification describe long-term shifts toward drier conditions that persist on human time scales.
[3] Vaillant, John. 2024. Fire Weather. Alfred A. Knopf. 414 pp.
[4] Wesson, Rob. 2022. De Saussure and the Heliothermometer. https://www.robwesson.com/adventures/de-saussure-and-the-heliothermometer.
[5] Carbon dioxide in Earth’s atmosphere. https://en.wikipedia.org/wiki/Carbon_dioxide_in_Earth%27s_atmosphere
[6] Anthropocene — A proposed geological epoch characterized by the significant global impact of human activities on Earth’s climate, ecosystems, and geologic processes. The term is used to describe the period during which human-driven forces—such as industrialization, fossil-fuel combustion, land-use change, large-scale agriculture, resource extraction, and widespread pollution—have altered atmospheric composition, accelerated species extinction, transformed landscapes, and reshaped the functioning of Earth’s natural systems.
April 1, 2026 @ 10:54 pm
Human climate change is not due to emissions. Human’s don’t really have that much effect on climate change.
https://cornwallalliance.org/2020/05/mega-drought-or-mega-propaganda/
Mega Drought or Mega Propaganda?
May 12, 2020 By Gregory Wrightstone
The southwestern United States is undergoing one of its worst droughts in 1,200 years and it is being made worse by man-made climate change. So says a new study released in the journal Science. ……..
A previous study by E. R. Cook and others (2007) took a look at droughts dating to the year 800 AD (Figure 3) and found that SW North America has experienced much worse droughts that were catastrophically bad, some lasting more than 200 years. One of these events culminated in the 12th century and is the likely cause of the dramatic collapse of the Anasazi culture.
December 24, 2025 @ 9:00 am
A nice presentation of advances in our understanding of carbon emissions.