

The Rio Grande at Its Driest: What 85 Years of Compact Data Show
Every year since 1940, federal and state water managers have accounted for the Rio Grande waters flowing past the Otowi highway bridge to Los Alamos. That annual volume determines how the river’s flow is allocated under the Rio Grande Compact — which is federal and state law that governs water sharing among Colorado, New Mexico, and Texas. The amount of water New Mexico must deliver for all uses downstream of Elephant Butte Reservoir — in New Mexico, Texas, and Mexico — depends directly on how much water arrives at Otowi. The gauge is, in the most literal sense, where the Middle Rio Grande’s annual water entitlement and delivery obligations are set.
Each of the three graphics below reveals important facts that are not well known.
The current drought is not without precedent — the infamous drought of the 1950s was comparably severe
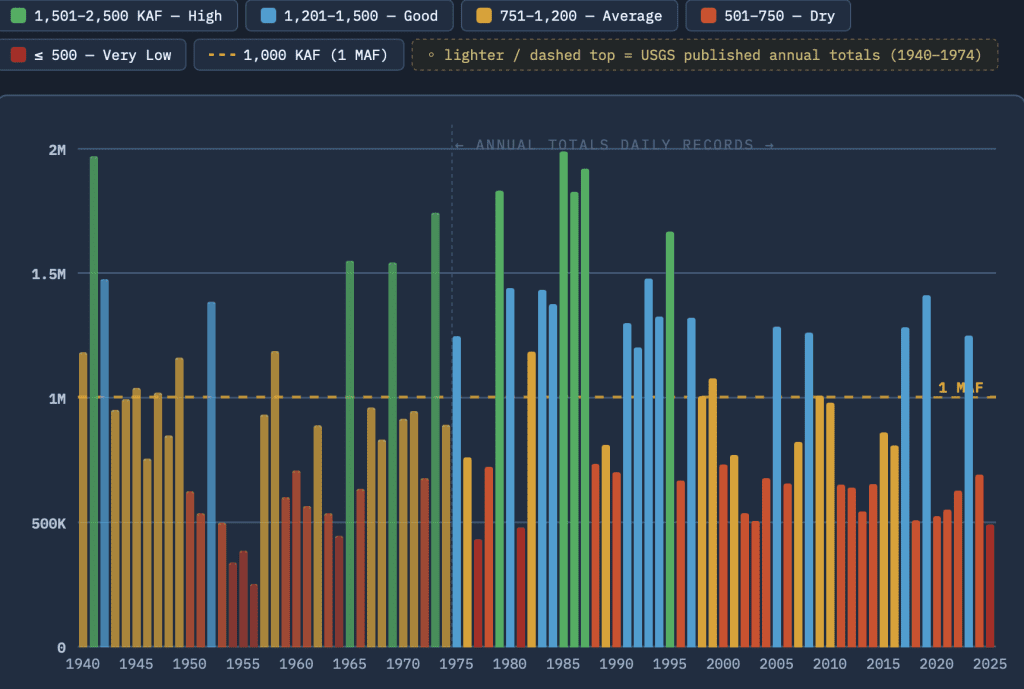
The first graphic spans the complete Compact era from 1940 to the present. It shows that the current drought is not without precedent — the infamous drought of the 1950s was comparably severe.
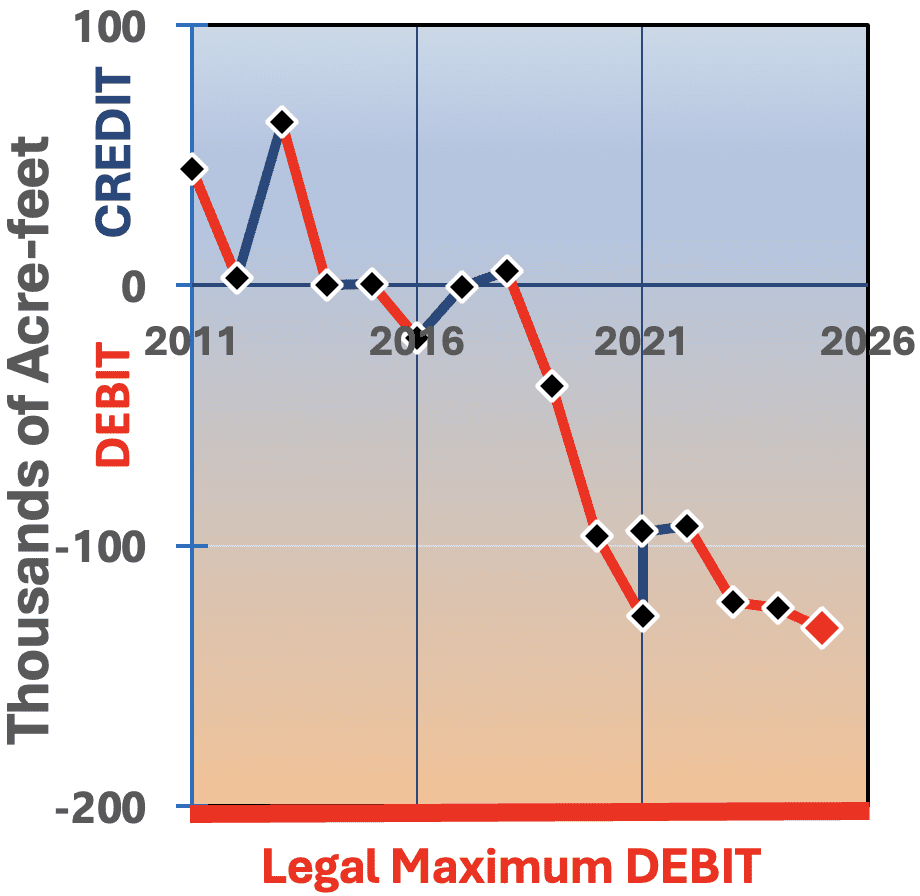
New Mexico has lost roughly one third of its Rio Grande water supply over the past fifty years
The second graphic examines the most recent five decades and reveals an alarming fact: New Mexico has lost roughly one third of its Rio Grande water supply over the past fifty years. The 1980s and 1990s were anomalously wet — a period that filled reservoirs and fostered a false sense of the river’s water supply blessings. Since then the basin has trended sharply dryer. El Vado and Elephant Butte Reservoirs have been essentially emptied, and Abiquiu Reservoir has been drawn down by roughly half — all in an effort to sustain water supplies and meet new federal endangered species requirements.
It has not been enough. New Mexico entered the current dry era holding substantial accrued delivery credits under the Compact. All credits have been consumed. Since 2018, New Mexico’s cumulative delivery deficit has risen to -132,000 acre-feet. This is a legally binding State of New Mexico water debt to Lower Rio Grande that has accrued over the last seven years.
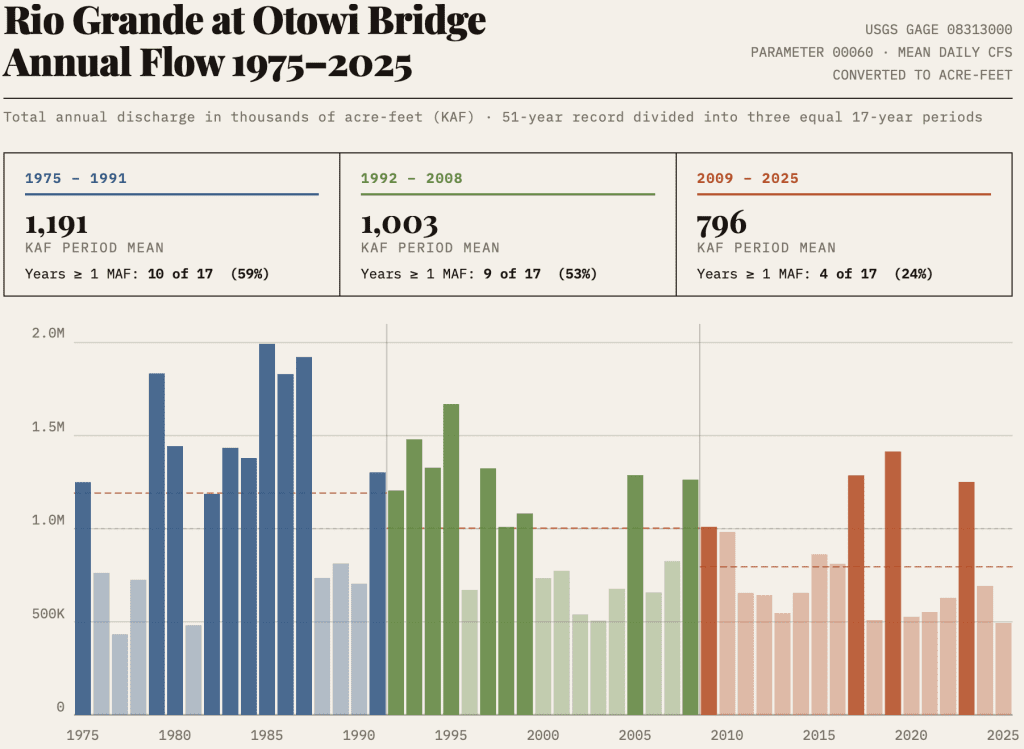
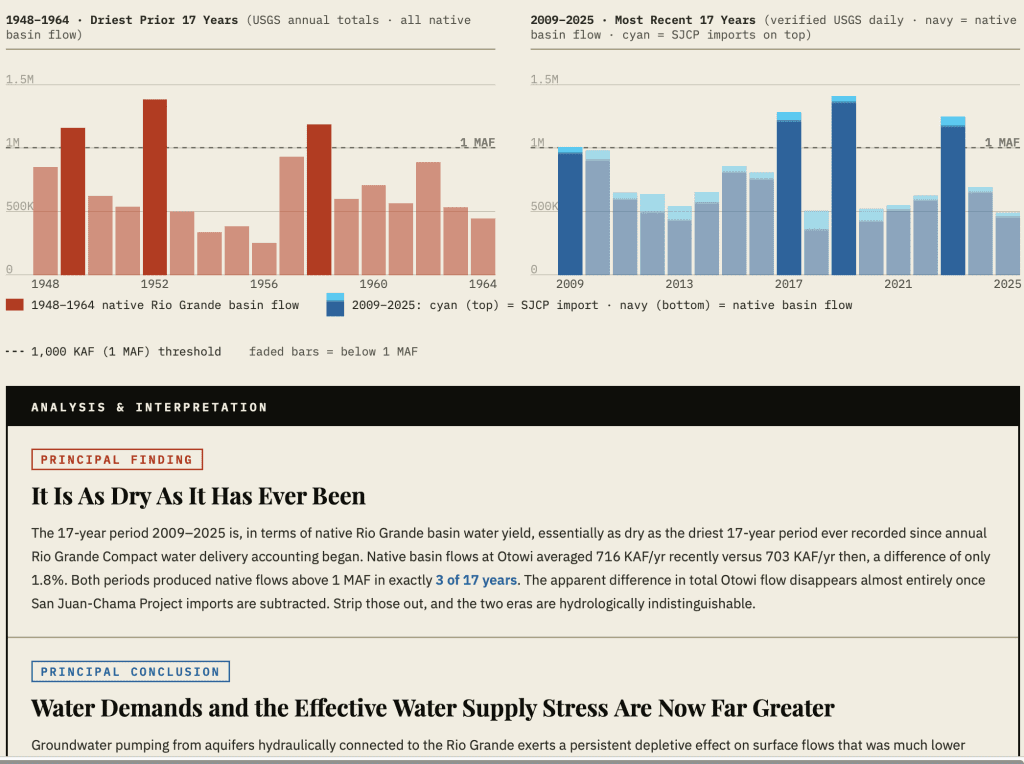
The third graphic completes the analysis by placing the most recent 17 years in direct comparison with the driest 17-year period previously recorded under the Compact, with full accounting of San Juan-Chama Project imports, contractor entitlements, and the graphically alarming storage history of Heron Reservoir.
The data support two conclusions that the third graphic documents in detail.
Principal Finding:
The 17-year period 2009–2025 is, in terms of native Rio Grande basin water yield, as dry as the driest 17-year period ever recorded since annual Rio Grande Compact water delivery accounting began. Native basin flows at Otowi averaged 716,000 acre-feet per year over the recent period versus 703,000 acre-feet per year from 1948–1964 — a difference of only 1.8%. Both periods produced native flows above one million acre-feet in exactly three of seventeen years. Strip out San Juan-Chama Project imports, and the two eras are hydrologically indistinguishable.
Principal Conclusion
The effective water-supply stress today is far greater than the raw Otowi flow numbers suggest, or than it has ever been
Groundwater pumping from aquifers hydraulically connected to the Rio Grande exerts a persistent depletive effect on surface flows that was much lower during 1948–1964 historic dry period, making the effective water-supply stress today far greater than the raw Otowi flow numbers suggest or than it has ever been.
During the 1948–1964 historical driest period, the Middle Rio Grande corridor had far fewer people and cities were much smaller: Albuquerque’s population in 1950 was roughly 97,000; today the metropolitan area exceeds 900,000. Municipal, industrial, agricultural, and riparian water demands are dramatically greater today, and rising temperatures have increased evapotranspiration throughout the basin. Decades of heavy pumping from the hydraulically connected shallow alluvial aquifer and the underlying Santa Fe Group aquifer have drawn down water tables along certain reaches of the Middle Rio Grande, causing greater losses from the river.
The third graphic is the most important. It presents this evaluation’s bottom line findings and conclusions, including the stark storage history of the San Juan Chama Project and the recent diminishment of its annual contributions to a reliable Middle Rio Grande water supply.
Please click each graphic in sequence to see the situation and pay particular attention to the third.
Rio Grande annual flows since 1940
Examining the Most Recent Five Decades
Comparing the Most Recent 17 Years with the Driest 17 Years Historically
Please be sure to click this thumbnail for the principal finding and conclusion including an alarming graphic pertaining to the reliability of San Juan Chama Project imported water supplies.
If analyses similar to this one are publicly available, I am unaware, so I invested the time to laboriously assemble the data. One element of the third graphic, for example, required specific data from the second page of 17 Rio Grande Compact annual accounting sheets posted as PDF images on the OSE/ISC website. The same documents are available as images from Colorado and Texas institutions.
No compact state, or the Bureau of Reclamation, or the Rio Grande Compact Commission has produced a digital dataset suitable for analysis of this rich data set. Note that the Interstate Stream Commission’s 2019 Water Data Act responsibilities would have the agency assemble all the pertinent annual terms for historical Rio Grande Compact accounting into a digital data set.
Comments and questions are welcomed.
Certification
I produced this short essay and the three HTML graphic web pages for public information using AI tools. I believe this essay and the HTML graphics presented herein are entirely accurate.
/signed/
Norm Gaume, P.E. (ret.)
Water Resources Engineer
NM License No. 6969
April 24, 2026 @ 3:50 pm
Is it OK to copy this presentation? thanks rip anderson
April 29, 2026 @ 12:25 pm
Yes, all Water Advocates content is available to share and distribute with full attribution. Copywriter photos that the Water Advocates has permission to use may not be copied.
April 24, 2026 @ 3:49 pm
Is it OK to copy this presentation? thanks rip anderson
April 9, 2026 @ 8:52 am
Has anyone looked at the impact of the Navajo Gallup Project when it comes on line? If memory serves, that projected is supposed to pump a net of about 36K AFY from the San Juan. Won’t that impact the amount available for the San Juan / Chama project? This would seem to be an acute problem at a time when the snowpack is at a record low and Navajo Reservoir water might be needed for Lake Powell.
March 19, 2026 @ 9:26 am
An impressive piece of work!!! Motivated by your earlier piece, “Renewable Water Supply Shortfall – Bad Too Soon,” I have devoted more time to researching and thinking about many of the same questions that you answer here — but lack the time and expertise to produce anything like what you have done . I have posted some short pieces on Facebook trying to educate local people on these issues and I would like your permission to sometimes use your graphics in these posts. You and your organization would be fully credited, of course.
March 19, 2026 @ 8:58 pm
Devin,
All the original work on our website is available for use by others in accordance with a Creative Commons license that requires attribution when shared in any form and that any derivative is shared under the same license. Please click the Creative Commons symbol at the bottom left corner of the home page to read the license requirement and terms.
Thank you for spreading the word.
Norm