

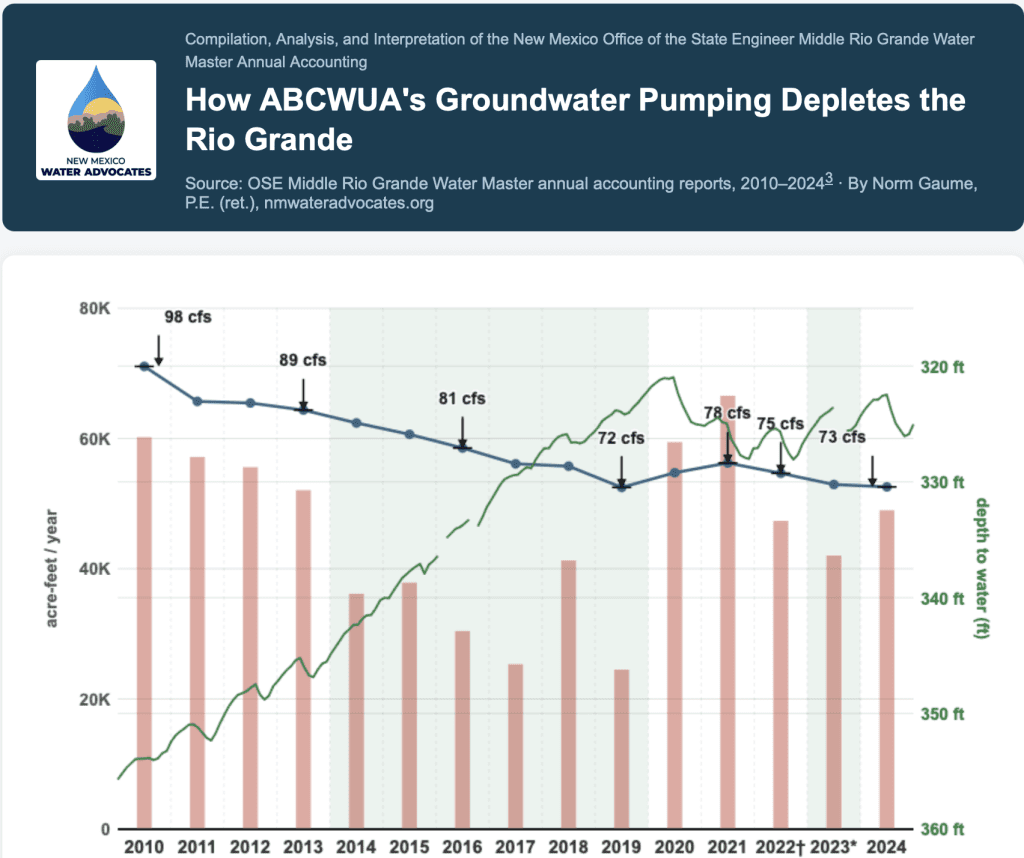
Fifteen years of annual water diversions and water rights accounting data prepared by the Office of the State Engineer Middle Rio Grande Water Master illustrate the outcomes of a remarkable but now threatened story of local water resources management. This chart shows how Albuquerque Bernalillo County Water Utility Authority (ABCWUA or Authority) groundwater pumping changes (red bars) caused groundwater levels to recover and reverse (green line), with a 25% reduction in the annual volume that ABCWUA current pumping and the residual of historical pumping depletes the Rio Grande (blue line).
This chart demonstrates the complex relationships among these annual variables:
- ABCWUA total water demand, minus
- ABCWUA Drinking Water Project treated surface water production
- Determines the volume of ABCWUA groundwater pumping,
- Which causes changes in the aquifer system, which in turn,
- Determines the annual volume of Rio Grande water depleted by gravity pulling a portion of the streamflow into the aquifer to refill the merged cones-of-depression caused by groundwater pumping.
Groundwater Pumping
The red columns show the annual groundwater pumped by ABCWUA under its primary permit no. RG-960 that authorizes pumping from all ABCWUA water supply wells except the Corrales Trunk wells. Annual groundwater pumping dropped considerably from 2010 through 2019 as the Drinking Water Project ramped up production of treated river water. The diversions were the volume of San Juan-Chama imported water that the Authority had arranged to be in the river available for diversion plus an equal amount of native Rio Grande water required to be replaced downstream in real time with treated municipal wastewater.
Prior to the Drinking Water Project start-up in 2009, local groundwater was the sole water supply source.
From 2014 to 2019, treated river water supplied half or more of total demand, with ABCWUA pumping groundwater to make up the remainder. Starting in 2020, declining availability of the sustained Rio Grande flows needed for long seasonal operation of the Drinking Water Project has reduced the number of days it can operate, cutting the hours of treated surface water production thereby forcing higher groundwater pumping.
Aquifer Response to Changes in Groundwater Pumping
The green line in the chart above represents the mean monthly depth to groundwater measured from the middle depth of three USGS dedicated monitoring wells located in a neighborhood park on Albuquerque’s near east mesa. The location was selected to be as far as possible from adjacent well fields.
The USGS Del Sol Divider groundwater level data collection started in 1996 and has produced 30 years of record, illustrated in the chart below. The line shows the depth from the ground surface to the well water level. The USGS online chart below shows the continuous measurements. The maximum occurs in late winter; the minimum is observed at the end of hot weather and the irrigation season. Comparing the late-season minimum from one year to the next reveals whether the water table is recovering or declining
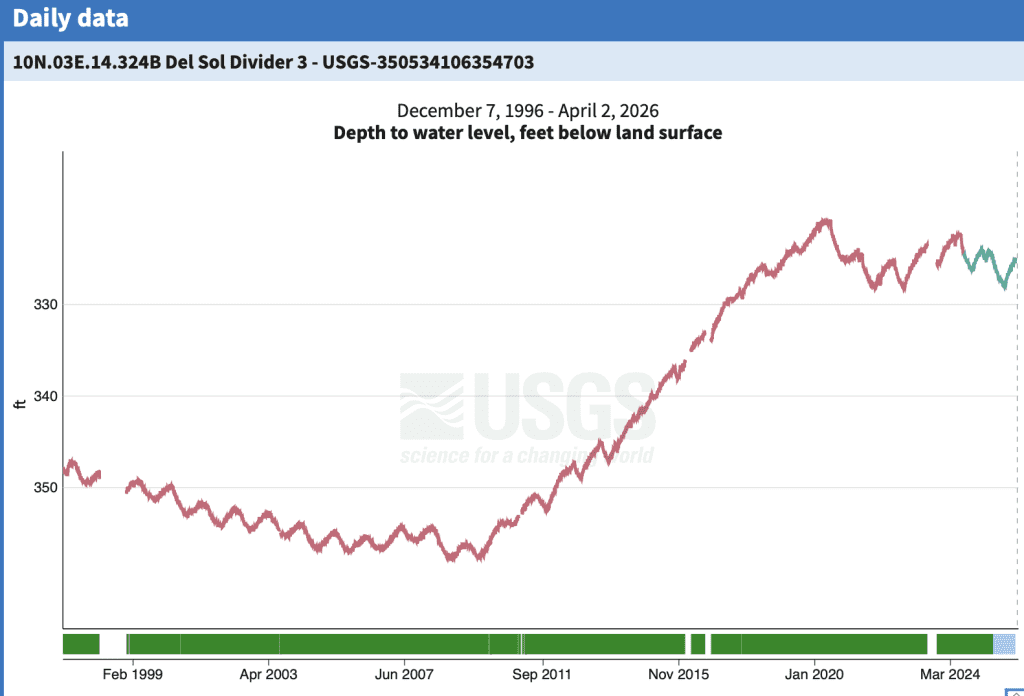 USGS Del Sol Divider #3 — site 350534106354703. Depth to water level, feet below land surface, Dec. 7, 1996 – Apr. 2, 2026.
The groundwater level dropped annually until about 2005 when the downward trend became less prominent, probably due to ABCWUA’s effective water conservation program. Then in 2010, with the Drinking Water Project start-up and production of 42,800 acre-feet of water from the river, the groundwater level didn’t decline with the summer pumping. The groundwater level recovered more than 30 feet between 2010 and 2020. The gains were more pronounced during the six consecutive years when the river provided half or more of ABCWUA’s annual drinking water supply.
Aquifer Recovery Stalled — 2020 to Present
Groundwater pumping shot back up in 2020 due to the lack of sustained Rio Grande flows needed to transport ABCWUA’s San Juan-Chama water to the Drinking Water Project intake. Conditions worsened: 2021, 2022, and 2025 were among the five driest years this century for Rio Grande water availability.1 The Rio Grande at Albuquerque dried for extended periods during the summers of 2024 and 2025 — part of the driest 17-year era ever recorded under Rio Grande Compact accounting — the first drying at Albuquerque in four decades.2 The Del Sol Divider water levels shown at the right side of the charts reflect this worsening of surface water availability through 2024.
How Much Aquifer Recharge from the River to ABCWUA Groundwater Pumping Cause?
After the USGS drilled a substantial number of monitoring wells throughout the Albuquerque area in a three dimensional arrangement and interpreted the aquifer’s complex, faulted geologic structure, the next step was to develop a three-dimensional computer simulation model linking the various layers of the aquifer, the river in the top alluvial layer, and deeper adjacent groundwater pumping from individual wells throughout metropolitan Albuquerque. The first USGS model was published in 1994. Many successive versions by the USGS and other modelers have followed, refined by installation of additional monitoring well nests and a lengthening history of measurements.
This monitoring shows the Albuquerque Basin groundwater flow system responds slowly to changes in annual pumping volumes. The induced recharge of the aquifer from the Rio Grande responds even more slowly to changes in pumping.
Historical pumping by the City of Albuquerque and successor ABCWUA removed vast volumes of water from groundwater storage. This pumping created a giant cone-of-depression, formed by the merging of the cones-of-depression of individual wells. The giant cone was broadly centered across the Albuquerque Uptown area and was 160 feet below predevelopment groundwater levels near the Sandia Mountain front.
The Office of the State Engineer developed an improved version of the USGS model and operates it annually, after the year has passed, to calculate how water flowed from the river to the groundwater system that year in response to pumping in the current year and historically.
The blue line in the main chart shows the modeled depletion of the Rio Grande caused by the most recent years and all historical pumping from ABCWUA system wells. For example, in 2010, 71,100 acre-feet flowed from the river to the groundwater system, which corresponds to a continuous flow of 98 cubic feet per second. The total groundwater pumping was 60,200 acre-feet and the Del Sol Divider’s monitoring well showed the water level was 354 feet below the surface.
Contrast that with 2019, the 10th full year of Drinking Water Project operations prior to the worsening water scarcity of the 2020s. Groundwater pumping was only 24,500 acre-feet. The Del Sol Divider water level had risen more than 30 feet. The induced flow from the river to the aquifer was down 25% to 72 cfs. That’s significant river and stored groundwater conservation.
Recent extreme surface water scarcity has caused this early progress to falter. Further substantial declines in the Del Sol Divider groundwater level are expected as aridification takes hold.
Conclusions
Aridification has invalidated major assumptions about the availability of surface water for the Drinking Water Project and its ability to permanently and reliably supply more than half of total demand — thereby substantially reducing ABCWUA’s dependence on local groundwater. These assumptions were central to both the planning that produced the Drinking Water Project and to the 2017 100-year water plan.
A 10-year update to that plan is due next year. This analysis makes clear that the situation requires a fundamental overhaul, not merely a routine update. Additional imperatives not discussed in this article concern the adequacy of ABCWUA’s water rights portfolio and ABCWUA’s obligations relative to other major water users under any Middle Rio Grande compact compliance framework.
Endnotes
1. 2021, 2022, and 2025 were three of the five driest years this century for New Mexico’s Rio Grande water availability. Data for the last 26 years were screened for the lowest annual volumes measured at the Otowi stream gage and below Elephant Butte Dam. The other driest years were 2002 and 2013. See also: Bardwell & Gaume, “Lower Rio Grande Water Settlement — New Mexico Water Advocates” (nmwateradvocates.org/lower-rio-grande-water-settlement-drinking-water-taxpayers-pecans/). For a broader aridification context based on 85 years of Rio Grande Compact accounting at the Otowi gauge, see: Gaume, “The Rio Grande at Its Driest: What 85 Years of Compact Data Show” (nmwateradvocates.org/rio-grande-driest-era-compact-history-otowi/).
2. Based on USGS stream gage 08330000, Rio Grande at Albuquerque. Consecutive zero-flow days were recorded in summers of 2024 and 2025 — the first such occurrences since the early 1980s. Channel drying downstream worsened with distance.
3. The OSE Middle Rio Grande Water Master annual accounting reports are not posted online. The Water Master provided digital copies for individual years. The author compiled them in the linked Excel workbook that was the basis of all analysis.
4. Per the ABCWUA Water Resources Management Strategy, the 100-year plan is subject to a 10-year update cycle. The 2017 plan update is due in 2027. ABCWUA is currently working on the revision. There are no mechanisms for public comment except the Board’s normal acceptance of comments at all public meetings.
This article and the main graphic are accurate within the limits of the input data. Graphic prepared using AI tools by Norm Gaume, P.E. (ret.), NM License No. 6969, retired New Mexico water resources engineer and President, New Mexico Water Advocates. April 6, 2026