At winter’s end early this year, the snowpack was low; the spring runoff forecast was dismal. Two federal agencies, the Bureau of Indian Affairs and the Bureau of Reclamation, stored all the native Rio Chama runoff in El Vado and Abiquiu to ensure a full supply for the six Middle Rio Grande Pueblos prior and paramount water rights. Of the approximately 34,000 acre-feet of water stored, 13% was used and 5% evaporated. Winter arrived again with 26,000 acre-feet remaining in storage.
Federal and state water agencies planned the release of this water. This article summarizes the fate of the release as the water flowed downstream.
A block release of the remaining 26,000 acre-feet of stored water began November 30. Water agencies intended that it flow unused into Elephant Butte Reservoir to reduce this year’s large underdelivery of the water that belongs to water users below Elephant Butte Dam. As of November 24, 2025, the Rio Grande Compact accounting model showed New Mexico’s deliveries were about 39,000 acre-feet short of the delivery obligation.
The hydrographs below show vividly what happens when water is poured down losing reaches of a river. We hope the OSE and ISC will collect a complete data set of this event, analyze it, and report their technical analysis and full data set.
Superimposed USGS hydrographs_Rio Chama winter block release. NM Water Advocates graphic
Let This Set of Hydrographs Tell Their Story
Let’s start with a summary of the MRG geography.. The Cochiti Dam releases drive the downstream responses, as the hydrographs above illustrate. The step increases in Cochiti Dam releases are in response to Abiquiu Dam releases to the Rio Chama upstream. The Abiquiu Dam releases flowed down the Rio Chama to its confluence with the Rio Grande, and down the Rio Grande into Cochiti Reservoir. Cochiti Dam releases were stepped up or down once daily to match the total inflows to the reservoir.
During the block release period, the Rio Grande below Cochiti Dam gage steps up rapidly to 2,000 cubic feet per second (cfs) for six days and then steps down. The Cochiti Dam release mimics the Abiquiu Dam release on the Rio Chama, which was sustained at 1,400 cfs for six days. The difference is water from the northern Rio Grande, measured at the Rio Grande at Embudo gage.
2025: An Extremely Dry Setup.
How much of the release made it to Elephant Butte? The answer begins with the conditions leading into the release. Rio Grande flows in 2025 set record lows. The runoff was small and brief. After the runoff ended prematurely in May, the riverbed was dry through Albuquerque and more extensively downstream for several months.
River water users did their best to meet their needs with increased groundwater pumping.
Floodplain and riparian vegetation— cottonwoods, willows, salt cedar, Russian Olive — drank from the wetted soil zones above the shallow groundwater table.
How Much Made It to Elephant Butte? Peak Flows at Downstream River Gages Reveal Large Losses
Individual hydrographs show consistently lower peak flows as the block release moved down the river. The pattern is clear.
Cochiti Dam release: Peak flows of 2,000 cfs were sustained.
Bosque Farms: The peak flow is much lower, delayed, and smoothed. Comparing the flow downstream of Albuquerque with the Cochiti Dam releases shows large losses through the Albuquerque reach.
San Acacia: The peak is lower still at this river gage at the head of the Socorro Valley, but not by a huge amount. The losses between Bosque Farms and San Acacia are relatively small.
San Marcial (floodway): The peak is further reduced and delayed. The river above San Marcial suffers especially high river losses. The river channel is perched several feet above the adjacent floodplain, trapped between levees on an elevated bed of accumulating sediment.
Elephant Butte Narrows: As of December 18, only a muted remnant of the original pulse has made it Elephant Butte Reservoir as of December 18.
Reclamation’s 1950s low-flow conveyance channel at San Marcial is added to the San Marcial river flow as the total surface flow moving downstream at that river location. Both flows come together before the Narrows gage.
Comparison of the San Marcial and Elephant Butte Narrows hydrographs shows significant intervening losses as the water flows down a temporary channel dredged by amphibious excavators to the Narrows. The channel is dredged through the top layer of the thick sediment beds that accumulated when the Elephant Butte Reservoir was routinely full and the pool reached almost all the way north to San Marcial.
Summary – What the Hydrographs Show
Each downstream gage captures a smaller and flatter version of the same release, indicating significant losses in every reach. Our calculations show the river lost more than 40% of the block release.
The Embudo gage provides a steady upstream reference.
The Abiquiu release provides a controlled input.
The Cochiti release shows their combined signal.
Everything downstream shows systematic attenuation clearly visible in the curves.
The Bottom Line
The block release was intended to move Prior and Paramount stored water downstream to Elephant Butte Reservoir.
The hydrographs show that much of the water never made it.
The Middle Rio Grande took it — into the channel, the banks, the shallow aquifer, and the steady flow to deep groundwater pumping zones.
Downstream river gages reproduce the Cochiti Dam stepped pattern, particularly the steps down. You can trace the first big drop. These data show a pattern that is consistent with what would be expected after a long season with a dry river, accelerated groundwater pumping, major riparian and domestic withdrawals from the shallow aquifer, and poor channel conditions.
This is more evidence that our current water uses can’t be sustained. Sobering thoughts to consider as a new, even drier year begins.
Understanding the Scientific Method and the Reality of Climate Change
A previous article described how our warming climate, also called “climate change,” is affecting New Mexico’s and other global water supplies.[1] Yet, some claim that climate change is not really happening, that it is a liberal hoax. However, most of those in the scientific and environmental communities say these global climate changes are indeed real and increasingly threatening life around our planet. What is the truth?
Here, it is important to understand that scientists using statistical methods can readily conclude that certain relationships are false, but statistical methods cannot prove that an alternative relationship is true with complete certainty. Instead, scientists assess important conditions that might cause or contribute to a suspected relationship, including using models addressing the possible cause-and-effect relationships (essentially, evaluating alternative assumptions).
By rigorously evaluating these different variables, scientists strive to determine whether a suspected link is truly causal or merely coincidental. This careful, evidence-based approach allows researchers to refine their understanding and minimize uncertainty in their conclusions. Even so, the remaining margin of doubt—often a mere 1% to 5%—is sometimes exploited by those seeking to undermine established scientific findings. Ultimately, the strength of the scientific method lies in its ability to recognize complexity, test alternatives, and continually improve our grasp of reality.
Also, when appropriate for the relationship in question, they assess any change in patterns of multiple health or environmental indicators. All of this leads to a “weight-of-evidence” conclusion that the stated link between cause and effect is real. In this example, climate warming and change are happening and are caused by emissions.
The typical 1% to 5% gap in absolute certainty that a relationship is real is routinely used by a small number of well-paid, industrial and politically sponsored “experts” to oppose strong scientific conclusions, such as tobacco smoking causes cancer, and emissions of carbon dioxide (CO2) and greenhouse gases cause climate warming and climate change. Then, too, there are those who just invent their own “facts,” independent of truth. Who should we believe? What does the research tell us?
To better understand the controls needed to limit and reverse climate warming, it is helpful to look at how scientific understanding of the interaction between CO₂ and solar heating in the atmosphere has developed. The following summary intends to help guide readers to meaningful answers about why our climate is warming. Indeed, the scientific understanding about climate warming and climate change has been assessed through environmental monitoring and modeling that has been conducted internationally for more than a century by hundreds, even thousands, of objective scientists.
A quadrant at the Jornada Basin in 1935 (left) and again in 2016 (right), showing the stark difference in grass cover and ensuing shrub encroachment over the last half century.
When considering this summary, it is important to understand that “weather” refers to the temporary, short-term atmospheric events occurring around us. In contrast, “climate” reflects the longer-term atmospheric patterns that persist over seasons, years, or decades.[2] A drought is therefore considered a climatic phenomenon rather than a weather event, while desertification represents a more permanent shift in climate conditions, as our previous article described.
How long has it been known that carbon dioxide and other greenhouse gas emissions warm our atmosphere?
Much of the scientific research history is laid out in the book Fire Weather by John Vaillant.[3] The first portion of his book describes the personal experiences of many individuals involved in fighting and being impacted by the wildland-urban interface fire that started May 2016 in the climate-dried forest five miles outside of Fort McMurray, Alberta, Canada. That fire grew into a greater than 1000oF firestorm that consumed much of Fort McMurray and its surrounding communities. The fire he describes is somewhat similar in scale and scope to the extreme fires impacting New Mexico, Southern California, and other western states during 2023-2025.
Six Scientific Milestones
Horace Bénédict de Saussure (1774) Demonstrates solar heat trapping with glass-covered “hot box.”
Eunice Newton Foote (1856) Shows CO₂ heats faster and retains heat longer than air.
John Tyndall (1859) Proves certain gases absorb infrared heat radiation.
Svante Arrhenius (1896) Calculates global warming from increased atmospheric CO₂.
John Henry Poynting (1907) Introduces the term “greenhouse effect” for atmospheric heat trapping.
Charles David Keeling (1958) Begins continuous CO₂ measurements revealing seasonal cycle and rise.
Then, Fire Weather’s chapter 19 starts Vaillant’s historical overview of the scientific understanding of how greenhouse gas emissions, particularly CO2, drive climate warming and climate change. The list below briefly summarizes his extensive overview of that history. The chronological narrative outlines how we now know that elevated atmospheric CO2 concentrations interact to produce climate warming that is progressively changing our planet’s atmospheric circulation and other climatic patterns.
July 16, 1774 [4] – Horace Bénédict de Saussure, a natural philosopher from Geneva, built an insulated wooden box, closed at the top with layers of glass and a thermometer placed on its bottom. He carried the box to a peak on the Italian side of Mont Blanc where he exposed it to sunlight. At that elevation of about 9,000 feet the air was 43°F. After an hour’s exposure to the sun, the temperature in his box had risen to 190°F. From this and his similar findings at other elevations, he concluded that little heat is actually absorbed by the atmosphere from the incoming sun’s rays. Instead, the sun’s heat is absorbed by Earth’s surface and then re-emitted, heating the atmosphere from the bottom up.His findings became known as “the Saussure hot house theory.”
August 23, 1856 – Earlier in 1856, Eunice Newton Foote filled one sealed gas cylinder with “ordinary air” from the room and a second with “carbonic acid gas” (that is CO2). Thermometers were inserted into both bottles. Inside the room both bottles were the same temperature. Then she exposed both bottles to sunlight outside. The air in the CO2-filled bottle heated twice as fast. Returning the bottles inside, the air in the CO2 filled bottle stayed warmer longer. On that date, a male colleague presented her results to the annual meeting of the American Association for the Advancement of Science with her concluding “glimpse into the future” that, “An atmosphere of that gas [CO2] would give our earth a higher temperature.”
1859 – In the earliest steps that led to increased CO2 in the atmosphere, “Colonel” Edwin Drake drilled his first oil well in Pennsylvania. Etienne Lenoir built a prototype of a commercially viable internal combustion engine. The Irish physicist John Tyndall presented to a meeting of the Royal Institution his confirmation that others had made over the previous century proving that concentration of “certain gases in our air” had the potential to trap solar energy and alter the Earth’s climate. Essentially, he described the greenhouse effect, yet to be named.
1896 – Henry Ford built his first car that year. Also, the Nobel Prize winning Swedish chemist Svante Arrhenius published his research on atmospheric warming and cooling due to changes in CO2 in the atmosphere. His detailed calculations, which were developed using earlier conclusions made by the geologist Arvid Högbom that industrial coal burning was warming the climate, indicated that a 50% increase in atmospheric CO2 from the 1890s levels would warm the Earth by 6 degrees Fahrenheit.
1901 – The meteorologist Nils Ekholm wrote that CO2 in, “The atmosphere may act like the glass of a green-house … letting through the light rays of the sun relatively easily, and absorbing a great part of dark rays [heat] emitted from the ground … [potentially raising] the mean temperature of the earth’s surface.”
1907 – The British physicist John Poynting, responding in an article to an earlier one written by the Boston-based travel writer and citizen scientist Percival Lovell, coined the concept term, “the ‘greenhouse effect’ of the atmosphere.”
1908 – In a significant step increasing the rate of atmospheric CO2 emissions, Henry Ford introduced his popular and widely purchased Model T. In the same year, Svante Arrhenius published the English edition of his “World in the Making: The Evolution of the Universe.” In it he wrote, “The enormous combustion of coal by our industrial establishments suffices to increase the percentages of carbon dioxide in the air to a perceptible degree.”
1938 – The Canadian born and British raised steam engineer and amateur meteorologist Guy Callendar published, “The Artificial Production of Carbon Dioxide and Its Influence on Climate” in a respected British meteorological journal. It was based on his hand analyses and plots of hundreds of years of temperature records from 200 weather stations around the globe. He concluded, in part, “Few … familiar with the natural heat exchanges of the atmosphere … [that cause] our climates and weather, would be prepared to admit that the activities of man could have any influence upon phenomena at so vast of scale. In the following paper I hope to show that such influence is not only possible, but is actually occurring at the present time.” His analysis of thousands of weather records showed that the mean global temperature had risen by 0.9oF from 1890 to 1935.
1956 – Canadian geophysicist Gilbert Plass used infrared spectroscopy to first challenge and subsequently reconfirm that long-wave, infrared solar heat is retained by water vapor and industrially emitted CO2 in the atmosphere. In his 1956 publication, Carbon Dioxide and Climate, Plass wrote, “virtually all known glaciers in both hemispheres have been retreating… There can be no doubt that this will become an increasingly serious problem as the level of industrial activity increases.” He emphasized that as the combustion of coal reserves continued to drive up atmospheric CO2concentrations, average global temperatures have the potential to increase “into uncharted territory.”
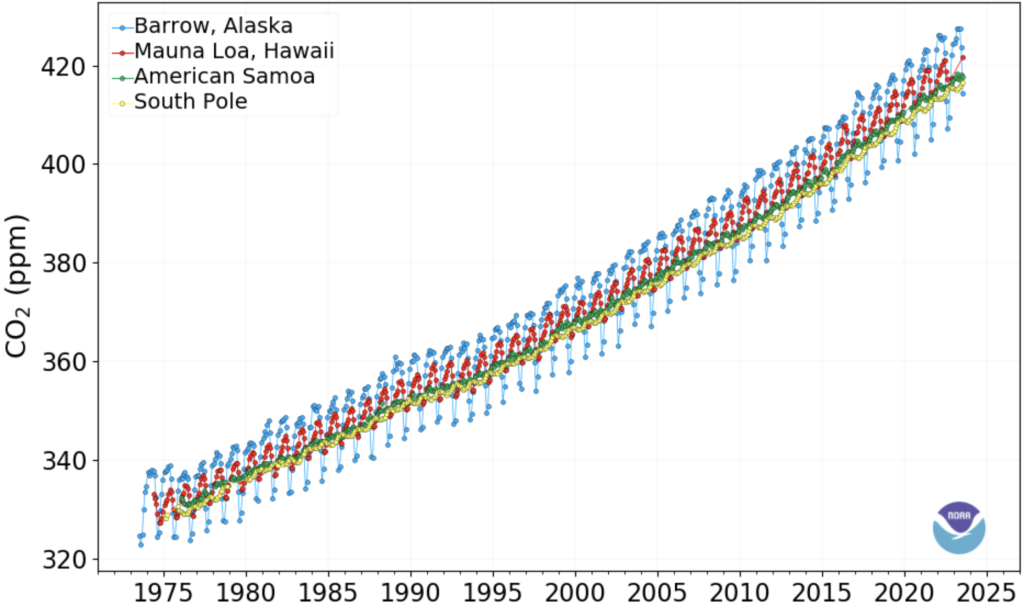
1958 – Mass spectrometer research starting in 1958, by the Scripps/Caltech geochemist Charles Keeling detected that atmospheric CO2 concentrations fell during the spring and summer months as plant photosynthesis increased. These CO2 concentrations then rose during the fall and winter months as plants became dormant. Keeling also found that the increasing annual trends for both atmospheric temperatures and CO2 concentrations matched (now called the Keeling Curve). Notably, his assessment of CO2 in ancient air from deep glacier ice indicated that the pre-industrial baseline atmospheric CO2 was approximately 280 parts per million (ppm), which started increasing in 1750 with coal-burning industrial development. By 1960, CO2 had increased to 315 ppm. In 2023 it had increased to 427 ppm (0.0427%), which is equivalent to 3,300 billion metric tons of CO2[5].
The Keeling Curve, Monthly CO2 Atmospheric Concentrations, NOAA Global Monitoring Laboratory
Vaillant emphasizes that Callendar was the first to document and chart how the Petrocene Age, as it is now sometimes called, was affecting climate. Vaillant also added that, while the term ‘Anthropocene’[6] had not been invented in Callendar’s time, he likely would have used it to characterize the period where humans have the dominating influence in affecting life on our planet. In our next article we continue the brief summary of Vaillant’s book’s description of how the political and popular perceptions of climate change and global warming have themselves changed.
Another Effect of CO2 Emissions: Water Acidification
As CO2 dissolves in water, including our oceans, it makes the water more acidic. Specifically, dissolving CO2 in water forms carbonic acid and in distilled water the resulting pH is 5.65. Water that is neither acidic nor basic has a pH of 7.0; a pH level of 5.65 means that the water is 22 times more acidic than the acid/base neutral condition. Fortunately, most of the Earth’s water has natural buffering, meaning it tends to resist increases in acid formation due to various minerals it has dissolved, particularly limestone.
Today, the changes in pH coupled with warming of water are causing the bleaching and death of major coral reefs, including the loss of their associated ecological communities of fish and other life forms. Concurrent changes are also occurring with other fish communities, whale populations, and many other populations of other species throughout our oceans. This CO₂-driven ocean acidification is compounded by ongoing sulfur dioxide and nitrogen dioxide emissions, which form sulfuric and nitric acids when fossil fuels-especially sulfurous coal and petroleum-are burned.
[2] The American Meteorological Society defines weather as the state of the atmosphere at a particular time and place, and climate as the statistical summary of weather over extended periods, typically decades. It defines drought as a “period of abnormally dry weather sufficiently long to cause a serious hydrologic imbalance,” placing it within the category of climate anomalies, not weather. Desertification and aridification describe long-term shifts toward drier conditions that persist on human time scales.
[3] Vaillant, John. 2024. Fire Weather. Alfred A. Knopf. 414 pp.
[6] Anthropocene — A proposed geological epoch characterized by the significant global impact of human activities on Earth’s climate, ecosystems, and geologic processes. The term is used to describe the period during which human-driven forces—such as industrialization, fossil-fuel combustion, land-use change, large-scale agriculture, resource extraction, and widespread pollution—have altered atmospheric composition, accelerated species extinction, transformed landscapes, and reshaped the functioning of Earth’s natural systems.
This excellence water science and policy paper has a lot to say. It should be required reading for all New Mexico elected officials. The report’s discussion of the data it summarizes and presents begins with this contrast between the Colorado River Basin’s and the Rio Grande/Río Bravo Basin’s water security problems and policy-makers’ attention.
The water scarcity challenges within the RGB basin have received much less attention from media outlets and national policymakers as compared to the Colorado River Basin (CRB) in the American Southwest. This can largely be explained by the comparatively smaller volume of water it carries (natural flows of 11,225 MCM/yr or 9.1 million AF/ yr) in the RGB [25] vs. 18,996 MCM/yr (15.4 million AF/yr) in the CRB [26], as well as the smaller population it serves with drinking water (15 million in RGB vs. 40 million in CRB) and the area of irrigated farmland it supports (7,800 km2 in RGB vs. 22,300 km2 in CRB) [2]. However, the water crisis facing the RGB is arguably more severe and urgent than the CRB, as illustrated by these conditions.
Data collection and interpretation by the authors leads to this conclusion.
We estimate that only half (48%) of water directly consumed for anthropogenic purposes is supported by renewable replenishment; the other half (52%) has been unsustainable, meaning that it is causing depletion of reservoirs, aquifers, and river flows. The over-consumption of renewable water supplies is primarily due to irrigated agriculture, which accounts for 87% of direct water consumption in the basin.
And this opportunity.
This water crisis presents an opportunity for the residents of the RGB to envision a new, more sustainable water future. The ‘Multi-benefit Land Repurposing Program’ underway in the water-stressed Central Valley of California provides one example of productive community dialogue around possible future scenarios [42]. The “Exploratory Scenario Planning” approach being advanced by the Lincoln Institute of Land Policy in various communities in the western US similarly offers ways to engage local communities in planning for their water future [43]. Any transformational strategies will require careful and inclusive planning, provision of strong financial incentives for farming communities to facilitate needed changes, and a bold willingness of water management agencies and decision makers to ensure water and food security for the region. Alternate pathways toward a sustainable water future are available for the RGB basin, but time is of the essence in correcting the highly unsustainable conditions that presently exist.
Is Beneficial Reuse of Oil & Gas Produced Water Feasible?
Simple Question, Complicated Answer
Ongoing research is focused on exploring both the opportunities and concerns of using treated oil and gas produced water for beneficial purposes. Progress is being made to narrow critical knowledge gaps, but a critical and not easy to answer question is paramount. What is the feasibility of properly treating this complex and highly variable fluid for beneficial uses?
Feasibility means not only whether something can be done, but whether it can be done consistently in a way that protects human health and the environment (technical feasibility) and is financially sustainable (economic feasibility). If either fail, the result will be adverse impacts to human health and the environment. In cases of non-economic viability, treatment facility closures invariably create legacy environmental issues with no responsible party on the hook to address impacts. Treating produced water for beneficial reuse is difficult, expensive, and unvetted by in-field scaled pilot testing – it is important to take the time to get it right.
Advancements have been by the New Mexico and Texas consortia, other research groups, and industry-lead efforts to identify and address critical knowledge gaps to inform regulatory policy and leading management practices for beneficial reuse of treated produced water. But there is still work to be done.
Produced water is an industrial waste, a wastewater generated during the extraction of oil and gas from underground reservoirs. Water trapped with the oil and gas resource along with a portion of fluid (water and chemicals) that are added for well completion (fracking and periodic maintenance) exits the well along with oil and gas for the life of the well. In many cases, produced water contains elevated salinity levels (many times the level found in seawater) along with inorganics, organics, and radionuclides.
The vast majority of produced water is injected back into the ground either for enhanced oil recovery (using the injected fluid to extract more oil from the formation) or in disposal wells permitted for that purpose. Increasingly, produced water us being “recycled” – used for fracturing subsequent wells instead of using higher quality waters thereby lessening the stress on those resources. Current data indicates roughly 60% of generated produced water in New Mexico is being recycled – this rate of recycling can and should be increased. Maximizing produced water recycling is the “low hanging fruit” in lessening environmental impact of well completions and produced water management.
Corroded, abandoned produced water treatment plant. Fairmont Brine. Photo credit: Justin Nobel
Beneficial Reuse
Even with maximizing recycling, some produced water must be managed. Considering the water stressed areas where oil production exists, treating produced water for discharge, aquifer storage, irrigation, or industrial use is worth considering. According to the NMPWRC, New Mexico generates roughly 4 million barrels (160 million gallons) of produced water daily, mostly from the Permian Basin. Estimating volumes for enhanced oil recovery and recycling, and accounting for the typical desalination process recovering 50% as treated water (the other 50% encompassing a concentrated waste stream); approximately 35 million gallons per day (39,200 acre-feet per year) could be available for beneficial reuse.
Technical Feasibility
Technical challenges to treat produced water to a quality appropriate for beneficial reuse are numerous. They include:
Produced water is a complex fluid that varies in levels of contaminants over time and across geographic location. It’s more than just the elevated salinity that poses challenges, numerous other potential contaminants of concern exist, many lacking analytical methods to detect them and/or toxicity information to determine concentrations that won’t damage human health and the environment.
Produced water is a relatively new industrial waste being considered for beneficial use. There are only a few full-scale treatment plants across the US treating this fluid for beneficial reuse (none in the Permian Basin) and a number of these have ceased operation leaving legacy environmental issues.
Research has made advances in narrowing the knowledge gaps around contaminants of concern and toxicity data and these efforts are continuing. The NMPWRC website provides links to several peer reviewed research papers on these topics. What is lacking are pilot studies of sufficient duration to better evaluate treatment process capabilities and limitations. Treatment system pilot studies are being performed both within the NMPWRC effort, by industry-led research, and by other research partners, but data sharing even within the consortium technical committees is lacking.
There is an accepted protocol for minimum duration and parameters for a properly scaled pilot study. It is detailed in EPA document: Protocol for the Verification of Wastewater Treatment Technologies.”[1] To-date, no pilot studies meeting the minimum duration for non-biological treatment processes (90 days continuous operations with no more than 9 days downtime) that includes transparency of all data on operation effectiveness and cost has been publicly shared.
Economic Feasibility
West Virginia Veolia-Antero-Clearwater produced water treatment plant before abandonment. Photo Credit: FracTracker Alliance
Less progress has been made (or at least publicly shared) on the economics of robustly treating produced water. This can be partly attributed to the previous discussion on the lack of scaled pilot projects operated for sufficient duration to determine all-in cost for treatment. There are research articles that allude to cost but again, details of these cost estimates (including if they represent all-in costs) are lacking.
What are all-in costs? They include:
Cost for collecting and transporting produced water from the point of generation to thepoint of treatment to the point of beneficial reuse.
Cost of constructing the treatment facility (amortized over the life of the facility).
Cost of operating the treatment facility including labor, operations and maintenance (including routine maintenance), and power. Power requirements are very large, raising questions about the power generating capacity needed to desalinate large amounts of high salinity Permian Basin produced water.
Properly managing all generated waste streams.
Circling back to the critically important aspect of economic feasibility – power requirements. Again, not only power cost but the power generation capacity to operate treatment processes. Estimates of new power generation capacity of about 1 to 3 gigawatts will be required for large-scale implementation of robust produced water treatment. For reference, one gigawatt of power generation could supply 750,000 to 1.1 million homes.
Research is being conducted, and knowledge gaps are being narrowed. This includes investigating the potential to extract materials/minerals of value to offset the cost for treatment. But again, this is only research. Scaled pilot projects demonstrating capabilities, limitations, and all-in costs are lacking.
Importance of Economic Feasibility
If the economic viability of a treatment plant is not sustainable, inevitably the treatment plant will be forced to shut down. A number of examples in the produced water treatment sphere demonstrate the harm of closed and legacy environmental issues left behind. It is critical to learn from these instances, ensuring these dangerous, abandoned failures are not repeated in New Mexico.
Fairmont Brine Processing in West Virginia was permitted to treat produced water. Numerous significant legacy environmental issues exist at the closed facility including TENORM and Resource Conservation and Recovery Act (RCRA) wastes. Per recent EPA documentation (Aug 2025), 46,200 gallons of RCRA mixed liquids and 62,747 gallons of TENORM liquids have been removed from the site.[2],[3]
Eureka Resources operated three produced water treatment facilities in Pennsylvania, one being the Standing Stone facility permitted to discharge into the Susquehanna River. The Standing Stone facility is now closed due to an apparent downturn in produced water sent for treatment. The Pennsylvania Department of Environmental Protection inspected the Standing Stone facility and identified numerous environmental issues including unresolved wastewater leaks, tanks holding water without functional containment, and “state Solid Waste Management Act violations that remain open for waste on the ground and other violations of the permit.” Eureka plans to close or sell its two remaining oil and gas wastewater treatment plants, both located in Williamsport.[4],[5]
Antero’s Clearwater facility in Doddridge County, West Virginia, claimed that it would turn produced water into fresh water and food-grade salts. The facility idled less than two years after beginning operations in 2017, citing a lack of cost effectiveness. Concerns over legacy environmental issues persist including radioactive and toxic waste.[6]
Austin Master Services in Martins Ferry, Ohio was permitted in 2014 to treat oil and gas wastewater. After concerns over illegally stockpiling wastewater and other oil and gas waste, leading to soil and water contamination, the Ohio Department of Natural Resources ordered that the facility shut down in 2022. Austin Master failed to comply with court orders and taxpayer dollars eventually were required to cover the cost for cleanup.[7]
Path Forward
There are good research efforts developing scientifically defensible data to move the needle in filling critical data gaps to inform potential treated produced water beneficial reuse policy and practices. Efforts of the New Mexico and Texas consortia needs to be supported and work by other research efforts acknowledged. But it is a process and there is still work to be done with transparency of data collection and evaluation to protect against trying to solve one issue only ends up creating others, potentially more difficult to address.
[4] Hess, D. (2024, August 23). Eureka Resources shuts down standing stone oil & gas wastewater treatment facility; DEP wastewater, waste violations continue from Feb. 2023. PA Environmental Digest Blog.
Dan Mueller is a registered professional engineer with over 40 years of experience addressing issues related to water resource management, water supply, and water reuse. Over the last 12+ years he has worked collaboratively with industry, academia, regulatory entities, and interested parties to identify and narrow critical knowledge gaps around recycle and beneficial reuse of oil and gas produced water. He is a member of the New Mexico and Texas produced water consortia. Dan holds degrees in aquatic biology (B.S.) and civil engineering (B.S. and M.S.), from the University of Texas.
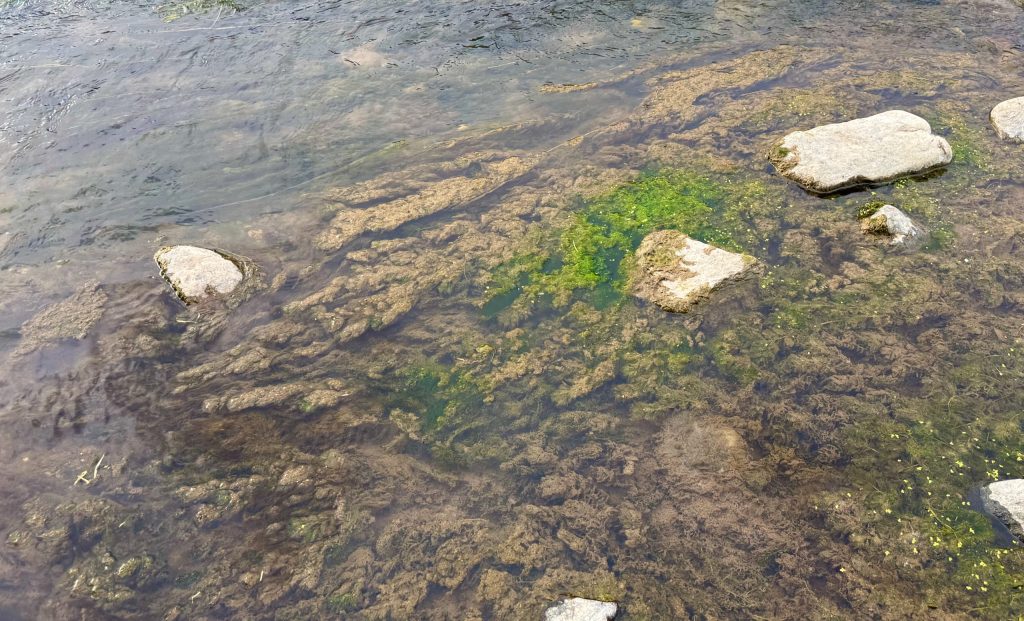
Visitors this past summer to the Río Grande del Norte National Monument observed that the river’s water, even upstream from its confluence with the Red River, appeared greenish. Why was that? As suggested in the above title, low river flows and high water temperatures, a result of climate warming as we described in a recent article, are part of the cause stimulating the greenish appearing algal growth in the river.
Fresh Water Algae
Some background first, freshwater algae have two main growth forms. Longer multi-celled strands of filamentous algae are most commonly found along shores and attached to rocks on the bottoms of slower flowing streams and rivers. Also, there are single celled algae, most species of which grow suspended in the water column. These are called phytoplankton.
Filamentous Algae at Pilar, NM river kayak & raft launch, N Gaume photo Sept 10, 2025
Some of these single celled algae species also form small clumps of cells in the water column. In more extreme cases, clumps of some species can become obvious to the unaided eye; some can even appear looking like someone had dumped grass clippings into the water, as a public member once reported as having happen for a high mountain Montana reservoir where I was assessing its water quality.
Other forms of single cell algae also grow in clumps attached to rocks and other substrates, particularly along the stream bottoms. These are called periphyton and are a critical food source for larval insects, other invertebrates, and small fish, such as the endangered Rio Grande Silvery Minnow.
The taxonomic groupings of many algae classes are based on color. Green and blue-green algae being the two most common forms found in fresh waters.(Blue-green algae now are more technically and often called cyanobacteria, due to having internal cellular structures more like bacteria than algae, but they still produce energy through photosynthesis, like algae, and can fix elemental nitrogen into biologically useful compounds.) Strands of filamentous algae along shores and attached to the stream bottoms are most commonly green algae.
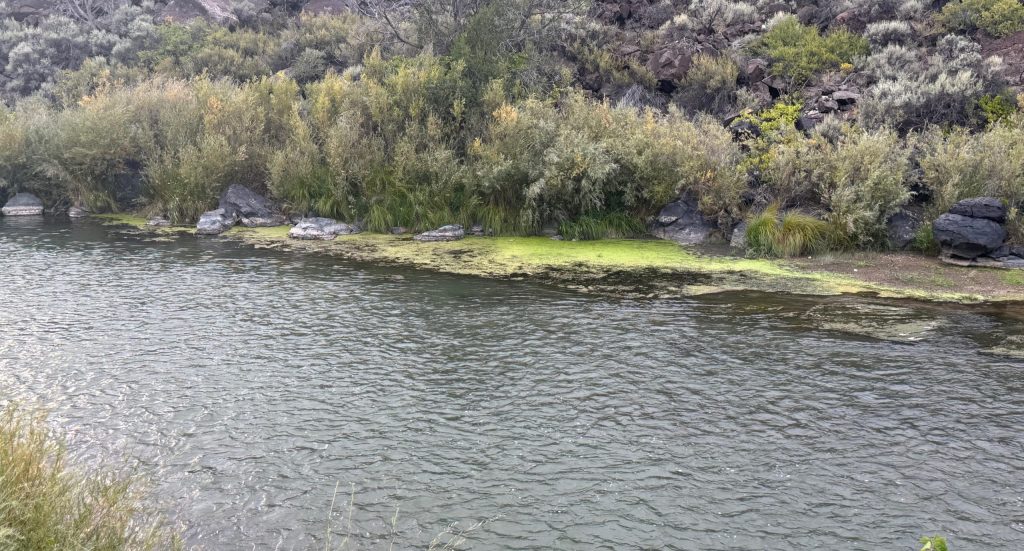
As the title above suggests, the greenish color of the river results from its low flow conditions and warm water temperatures, in part, with both tending to stimulate growth conditions for plankton that add their color to the water. Slow flowing or standing water is necessary for abundant planktonic algae to grow; higher flows with turbulence mixing tend to inhibit the growth of these algal forms.
Algae Growth at Pilar boating launch ramp, N Gaume photo Sept 10, 2025
Nutrients and Sources
The other likely cause of greenish appearing water and abundant plankton growth is commonly due to excess nutrients in the river. The nutrients of particular concern here are primarily nitrogen and phosphorus, which can occur in excess in the runoff from upstream agricultural fields and potentially from their residual concentrations in treated wastewater discharges and septic tank seepage to the river.
Of particular interest for the upper Rio Grande, drainage waters from volcanic geologies, prominent along the upper Rio Grande watershed, can include relatively high dissolved phosphorus concentrations. Such water chemistries can tend to favor growths of those blue-green algae species that can fix elemental nitrogen to stimulate their growth and population numbers. Without most detailed analysis of the river’s water chemistry, this can help to explain why the upper Rio Grande has appeared greenish, even blue-greenish this past summer.
Toxicity?
Here it is important to emphasize that not all types of blue-green algae produce toxins and those that can, do so mostly when water conditions are such for this to occur, which can include elevated water temperatures and nutrient chemistries. As such, this past summer the Bureau of Land Management was appropriate to issue caution regarding the potential for toxicants accompanying the their reports of blue-green blooms in the upper Rio Grande. Fortunately, it appears that no adverse toxic effects to individuals or pets seem to have occurred. That caution likely should continue into the future summers as recurring cyanobacteria blooms are likely to occur as climate warming continues and perhaps intensifies.
We frequently hear and read that NM is in a drought. But then I recently learned that an acequia board commissioner says that he doesn’t believe we’re in a drought, just a temporary lack of water. So, what is a drought and are we in one?
Defining Drought: A Temporary Water Shortage
Going to the internet we learn that drought is generally defined as a prolonged period of abnormally low rainfall or total precipitation, leading to a shortage of water for some activity, group, or environmental sector. It’s a complex phenomenon that can manifest differently depending on the region and the specific needs being affected. Droughts can last anywhere from a few weeks to several years. Certainly, NM and the SW would qualify as being in a drought as we have had a “shortage of water” for several years, at least. So, “drought” implies a temporary climatic condition that typically reverses within weeks, months, or a few years.
When Drought Becomes Aridification
But what should it be called when the water shortage period is longer, perhaps not reversible within a decade or perhaps much longer? Then, two additional terms become relevant to consider: aridification and desertification. Again, going to the Internet we learn that aridification refers to a gradual process during which a region becomes increasingly dry, moving towards an arid or desert-like climate. It’s not just about a temporary lack of rainfall (drought), but a long-term shift towards a drier state, often linked to climate change and increased temperatures.
Desertification: A Long-Term Climate Threat
In turn, we learn that desertification is the degradation of land in already dry regions, influenced by both natural factors (like climate change and droughts) and human activities. Certainly, NM and the SW would qualify as “land in already dry regions” and appear to be getting drier. Thus, both aridification and desertification are terms currently appropriate to apply to NM and the SW in general. A clear dividing line between the terms does not appear to exist.
Climate Warming as the Driving Force
Note that for both the concepts of aridification and desertification, climate change can lead to their defined conditions. Here it is important to recognize that the term “climate warming” as the actual cause now driving both concepts. It is the increasing rate that solar energy heats the atmosphere, causing the increased drying of soils as well as the alteration of historic wind, precipitation, hurricane, and other storm patterns, all of which can be collectively called “climate change.”
Scientific Evidence for Climate Change
We currently hear some politicians assert that claims of the ongoing patterns are climate change as being a hoax. They say we are not experiencing human-induced climate warming nor is climate change due to emissions of carbon dioxide, methane, and other greenhouse gases occurring.
In contrast we know the simple facts that a great diversity of scientific investigations starting in at least in 1774 have shown that inputs of the sun’s energy heats the earth and our atmosphere. Then beginning in 1856, we additionally learned that increasing the concentration of carbon dioxide in the air can produce a greater magnitude and persistence of atmospheric warming by the sun.
Today, there is abundant solid scientific evidence from modeling and monitoring, as well as from direct every-day observations that new records are being established locally and regionally for daily, seasonal, and annual high temperatures in the air around us as well as new records for the extents and durations regional floods and wildfires. These changes are being directly linked to climate warming alterations to air flow patterns, collectively disputing claims that increasing threats from climate change are a hoax.
Clearly, it is appropriate to claim that increasing aridification is occurring in NM and across the SW. What about claiming that desertification is occurring? Here we turn to scientific information produced by atmospheric modeling and monitoring. These results document how climate warming is significantly altering atmospheric circulation and causing shifts in wind patterns.
The Role of Atmospheric Circulation (Hadley Cells)
Of particular concern for us in the SW is how the atmospheric circulation patterns are changing. One of these major air circulation patterns (Hadley cells) result from hot, moist air rising from the equatorial tropics. This air then flows northward and southward, dropping rain and drying out along the way until this dried air historically has fallen at about 30 degrees north and south latitude tending to produce dry often desert conditions on the ground below.
Monitoring has revealed that the downdraft edges of the Hadley cells have expanded poleward by about one degree latitude in each hemisphere, with the magnitude of the expansion dependent on global temperature increases. The scientific literature reports that this indicates the total amount of latitudinal expansion of the Hadley cells over the period 1979–2005 was about two degrees in latitude, north and south. Over that same period the increase in global temperature was about 0.5°C. The poleward edges of the Hadley Cells appear to move about two degrees poleward in latitude for each degree Celsius of global warming. Of interest here, the internet tells us that, “Current policies are projected to lead to a 2.7°C median warming above pre-industrial levels by 2100.”
Currently, the rate of climate warming is expected to increase steadily as the United States’ past regulatory efforts to constrain or even to reverse climate change are now themselves being reversed. Based on the above temperature increase and the Hadley cells expansion rate, the northern (and southern) drying down draft of desert forming air could move its historical location of approximately 30 degrees latitude north (and south) to approximately 35.4 degrees.
What Desertification Means for New Mexico
Albuquerque is located at about 35 degrees north latitude. Therefore, due to the increasing likelihood of rapid atmospheric warming, it is clearly appropriate to describe NM as being at present risk from desertification, if it is not already impacting some, particularly southern, part of our state.
Water Resource Challenges in the Middle Rio Grande Valley
These climate warming projections point to the urgent needs for NM and other SW states to implement new, dynamic approaches for water resource management. This becomes a particular concern for those living along the Middle Rio Grande Valley who are being threatened both by prospects of desertification increasing into the future and by requirements to meet Rio Grande Compact delivery flows to Elephant Butte Reservoir. (We have previously characterized the pending crisis related to the Compact: https://nmwateradvocates.org/middle-rio-grande-compact-compliance-crisis-deepens/).
Acequia Traditions and Shortage Sharing
When periods of drought threaten acequia communities these threats are addressed through a practice called “shortage sharing.” Typically, since all acequia members know each other and work together to maintain their acequia system, they develop levels of empathy toward each other and share the water shortages to ensure that no one suffers disproportionally.
Conclusion: Preparing for a Drier Future
Current and upcoming water shortages along the MRG valley and elsewhere across NM require even a greater degree of water user empathy toward each other to implement the magnitude of shortage sharing now becoming required. Of concern, MRG water users lack the level of neighborly relationships found in acequia communities. Therefore, to develop the necessary regional-scale of water management that can produce water distribution equities similarly to those found with acequia shortage sharing clearly requires extensive regional planning efforts that we discussed elsewhere (https://nmwateradvocates.org/why-nm-water-planning-matters/).
The Middle Rio Grande’s 2025 River Water Supply Has Collapsed
A Sobering Conversation
On Friday, August 1, a kind and knowledgeable hydrologist at the Bureau of Reclamation’s Albuquerque office responded to my questions about the Middle Rio Grande’s river water supply and our year-to-date Compact deliveries to Elephant Butte. The answers were sobering.
The Future Has Arrived Early
It’s time to stop talking about New Mexico’s projected 25% reduction in renewable surface and groundwater supply by 2070. That number, from the widely cited 2021 report by the New Mexico Bureau of Geology and Mineral Resources, now understates our crisis. The 2025 shortfall in river water supply is more than 50%.
The riverbed through metro Albuquerque is dry. The Bureau of Reclamation’s San Juan–Chama Project, which imports water from the Colorado River Basin, hit a record-low allocation in 2025. This year’s water for project contractors is down 69% from a full supply. That’s a massive shortfall for the Albuquerque Bernalillo County Water Utility Authority, which receives about half the water, and the Middle Rio Grande Conservancy District , which receives about a quarter.
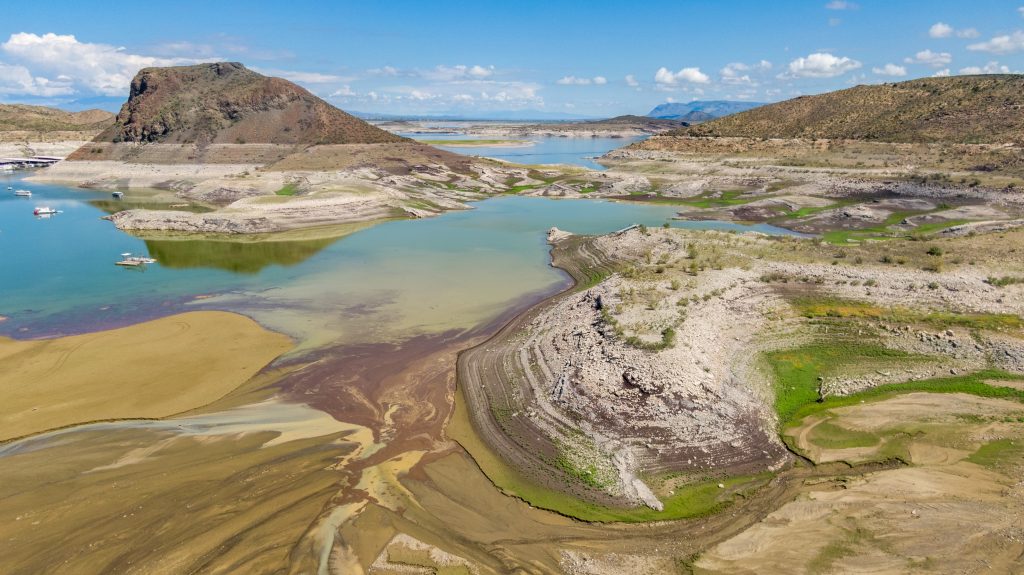
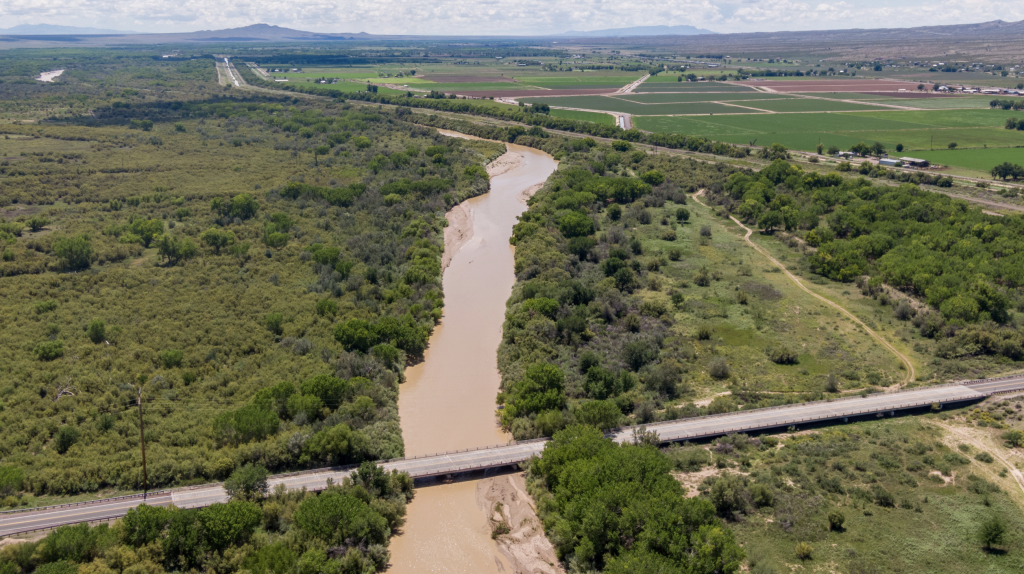
Data show the decline in river flows over the last 50 years, as illustrated in the chart below that I prepared in early June. The drone photo below the chart shows the river channel at the US380 highway bridge near San Antonio in August 2022, a relatively dry year. The river there had water then and the fields are green. This year, the fields may be green but due to rain and groundwater pumping. The river is dry.
Rio Grande at US380 Bridge near San Antonio NM, August 2022. Credit: The Water Desk. c Mitch Tobin
Compact Risk Is Flashing Red
At the May 15 Water Advocates workshop*, State Engineer General Counsel Nat Chakeres stated his belief that the Middle Rio Grande would avoid a Rio Grande Compact violation this year because the water delivery obligation to Elephant Butte is so low. I concur.
But unless the unusual 2025 monsoon delivers a lot more water across the dry watersheds to the river, the Middle Rio Grande’s accrued water delivery debt will rise to roughly 160,000 acre-feet—using up half of New Mexico’s remaining margin. That margin is our buffer before high-stakes interstate litigation returns.
If we exceed the 200,000 acre-foot legal cap on cumulative water delivery debt, we will once again face Texas in the U.S. Supreme Court—this time in another risky, high stakes case that will cost over $100 million and a decade or more to defend. The still ongoing 2013 lawsuit filed by Texas and joined by the United States over New Mexico groundwater pumping in the Lower Rio Grande cost more and is taking longer.
Texas’ formal attempt to bring Middle Rio Grande under deliveries into the ongoing Lower Rio Grande litigation failed, because we remain in compliance, that is, our water delivery debt doesn’t exceed the cap. The Compact creates a clear dividing line that isolates the Middle Rio Grande from the Lower Rio Grande, but only as long as the Middle Rio Grande remains in compliance.
What Must Be Done
We must acknowledge that our renewable water supply is shrinking now—not decades from now. And we must act accordingly. Either we take strong action to comply with the Compact, or we will be forced to devote our state’s water agencies to the enormous task of defending a new Supreme Court case—this time involving water for half of New Mexico’s economy and population. And we will be forced to comply, but with less leeway and discretion.
*Visit the “Past Events” tab at nmwateradvocates.org to access the May 15 workshop recording and slides.
Technical Notes:
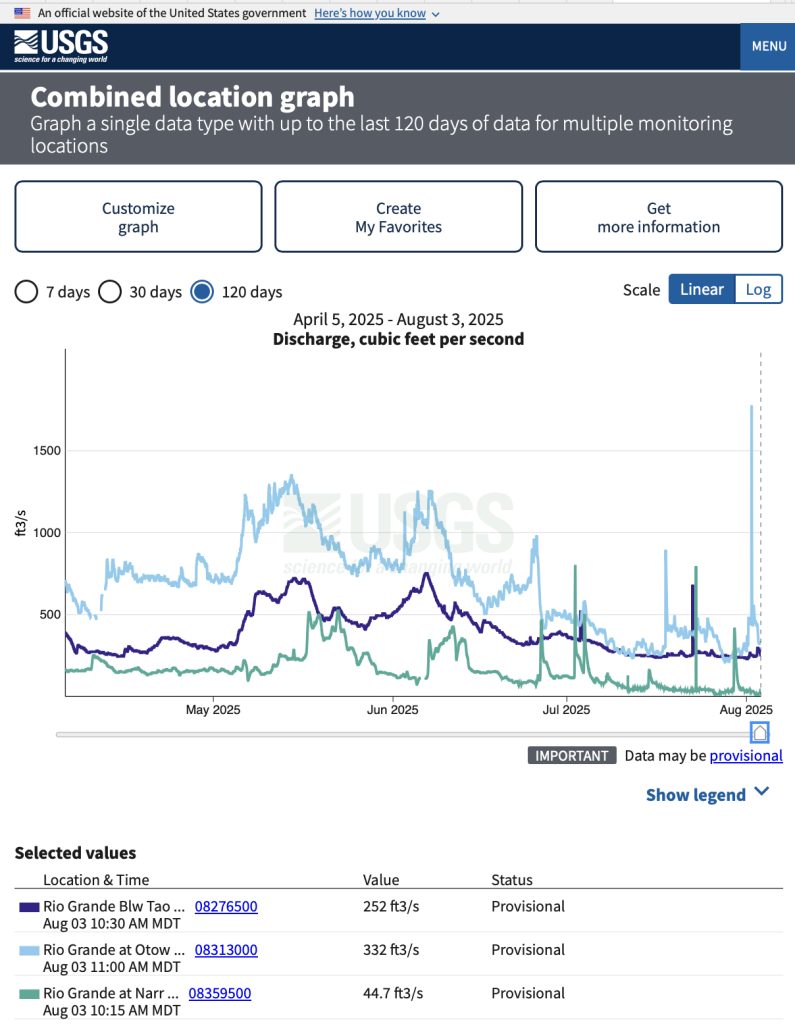
This U.S Geological Survey Chart
The light blue trace in the chart below is from the U. S. Geological Survey’s river streamflow gage at the Otowi Bridge on the Los Alamos highway. It measures Rio Grande Compact inflows to the Middle Rio Grande. San Juan-Chama water volumes are subtracted from the gage reading, which is also adjusted for changes in upstream reservoir native water storage.
The green trace measures the outflow from the Middle Rio Grande at the Narrows within Elephant Butte Reservoir, where the river is flowing in an accessible channel many miles upstream of where the stored water pool has retreated. This is a temporary gage and is useful. The Rio Grande Compact actual water delivery is calculated as the change in storage in Elephant Butte Reservoir plus the release through Elephant Butte Dam.
The dark blue trace shows the flow of the Rio Grande downstream from the Rio Pueblo de Taos. It measures Colorado’s stateline deliveries, tributary inflows and the flows including the Red River and the Rio Pueblo de Taos, and large springs in the upper Rio Grande Gorge. Most of the additional water measured at the Otowi gage (light blue) comes from the Rio Chama, the Rio Embudo, and inflows minus diversions upstream from Espanola.
Comparison of the light blue and green traces shows very little of the inflow to the Middle Rio Grande has made it through. The compact requirement is 57% on an annual basis.
Current Data from Reclamation
Reclamation’s hydrologist said the Otowi gage flows include delivery of 33,884 acre-feet of San Juan-Chama project water in 2025 year-to-date. MRGCD has used essentially all of its allocation.
Federal agencies stored 32,668 acre-feet of native Rio Grande water under conditions when the Compact does not permit storage to guarantee water to meet the “prior and paramount” irrigation requirements for certain Pueblo lands. Of that total, 2,100 acre-feet has been released as of the end of July. The current rate of release is 40 cfs. It has been as high as 60 cfs. All remaining water will be released for delivery to Elephant Butte after the end of the irrigation season. Ir’s rare that prior and paramount water is used because normally the minimum flow of the river is enough. A substantial amount may remain, or not, depending on the monsoon.
The Upper Rio Grande Water Accounting Model shows the Middle Rio Grande’s year-to-date underdelivery of water to Elephant Butte as of the end of July is – 39,000 acre-feet.
The Interstate Stream Commission (ISC) staff’s proposed rule to implement the 2023 Water Security Planning Act (WSPA) is structurally flawed, legally overreaching, and misaligned with the law’s purpose. The WSPA was enacted to support decentralized, data-informed, and science-based water security planning across New Mexico. Instead, the proposed rule concentrates inappropriate, poorly defined authority in the hands of ISC staff.
It presumes that internal staff policy decisions—many of which constrain regional initiative—should be embedded in rule, without ever being considered by the Commission. It contradicts the Act’s clear delegation of planning responsibilities to regional councils. It even instructs councils to proceed with planning whether or not data are lacking, undermining the scientific integrity that the WSPA mandates.
Despite taking two years to prepare, the proposed rule is vague, contradictory, and fails to meet drafting standards for state rules. The staff-proposed rule lacks clarity, misinterprets statutory intent, and fails to learn important lessons from failures of past ISC-directed regional water planning in New Mexico that used imaginary information.
This article outlines core flaws in the proposed rule and proposes a smarter path forward: pause the rulemaking, adopt interim guidelines that fund and support regional initiative, and return to the formal rule process only after meaningful engagement, learning, and course correction—grounded in statute and committed to decentralization. The Water Advocates described the flaws and pointed out the better way in public comments offered for the Commission’s consideration.
The proposed rule substitutes staff discretion for Commission-level decisions and undermines both scientific integrity and the decentralized authority that the Act assigns to regional councils.
The Water Advocates Support the ISC’s definition of the regional water planning council areas, as shown. The boundaries make sense and are well examined by ISC staff and explained.
Centralized Control Where Regional Responsibility Is Required
At it’s heart, the WSPA is a commitment to decentralized planning: regional councils are charged with developing water security plans, while the state is to support councils’ work by providing technical and financial support with clear content and approval criteria. The Act requires the Commission to define council composition, support plan development, and approve plans based on established rules. Nowhere does it authorize the ISC staff to initiate the formation of regional councils or approve each council’s membership.
Yet the proposed rule does exactly that. Rule 10 A.(1) asserts that NMISC staff will invite government entities to select representatives and will convene the initial meeting of each council. This is a fundamental overreach. The WSPA assigns the duty of plan development to regional councils themselves. The Commission’s statutory role is to establish composition standards—not to centrally initiate, schedule, or approve when and how councils form. Rule 10(C) makes this overreach worse by stating that self-organized councils must be “confirmed by NMISC staff”—but confirmed according to what criteria? The rule provides no standards, thresholds, or procedural guidance.
The problem extends further. Staff would be granted authority to review and approve council composition when vacancies occur, with no defined criteria, timeline, or appeal process. Rule 12 empowers staff to substitute non-voting members for voting members if a “qualified or willing” representative cannot be identified—but fails to define either term or require Commission oversight. These and other provisions allow staff to shape council membership and authority with excessive discretion, undermining the WSPA’s statutory structure by assigning staff roles the law reserves for regional councils or the Commission itself.
Many regional leaders lack only a legitimate framework and resourcing strategy that honors their statutory roles and the decentralization mandate.
Failure to Meet Statutory Requirements
The WSPA includes several specific rulemaking mandates that the proposed rule fails to fulfill. Two are particularly critical:
Section 8(C)(1)(c) requires rules that establish a procedure for regional entities to develop and notify the Commission of regional public welfare concerns.
Section 8(C)(1)(e) requires rules that establish a procedure for regional entities to consider public welfare values and the needs of future generations.
The proposed rule establishes no procedure for Councils to raise such concerns to the Commission, and no structured process for evaluating those concerns in regional planning. These omissions are direct failures to implement core provisions of the statute.
Integrity of Planning
Scientific integrity is another area where the proposed rule falls short. The rule language evades the statute’s clear mandate that the Commission must both provide the best information and ensure it is used with scientific integrity.
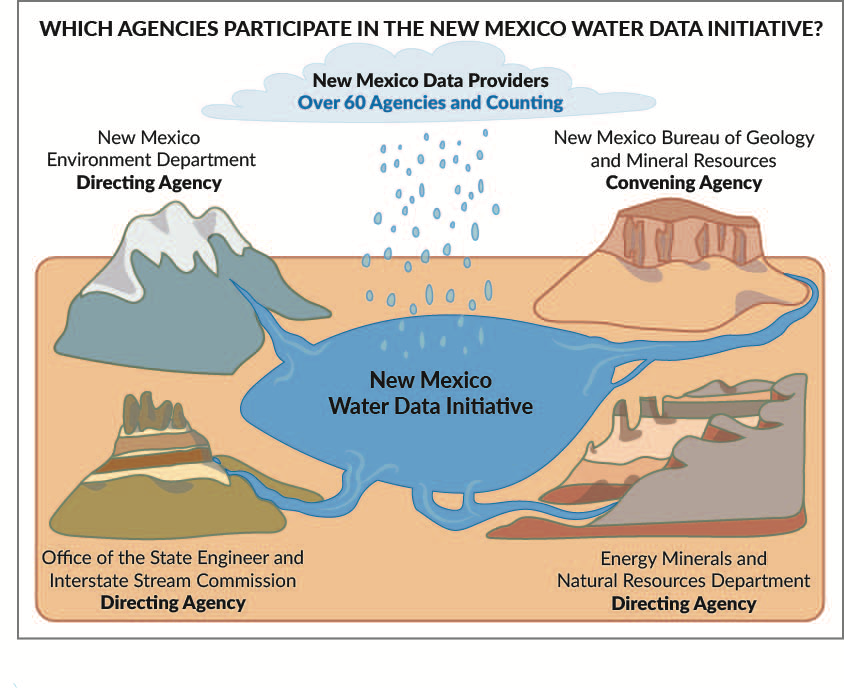
The Water Security Planning Act plainly requires the Commission to ensure “the best science, data, and models relating to water resource planning are available to the regional water planning [councils] and are used with scientific integrity and adherence to principles of honesty, objectivity, transparency, and professionalism.” It further requires the ISC to carry out this responsibility in collaboration with the Bureau of Geology and to do so through Bureau’s New Mexico Water Data Initiative.
Credit: NM Bureau of Geology and Mineral Resources
The proposed rule omits any reference to this specific ISC duty and makes no mention of the Water Data Act platform. The rule instead offers only vague references to “assistance with accessing” data. Worse still, the proposed rule says, “Councils may not delay the development of or updates to a plan due to lack of data.”
Water planning without water data is not water planning with integrity. The rule drafters may have had a more complex idea in mind, but the language is too terse to communicate the circumstances where Councils may not delay due to lack of data.
Nothing good came from the ISC’s 2018 regional water planning updates that ISC asked be completed without real data. New Mexico has seen the costs of ISC’s turning its back on scientific and decision integrity during the Gila River Diversion process from 2004 through 2020. The 2023 Water Security Planning Act explicitly corrects those problems, among its many changes. The proposed rule doesn’t operationalize these reforms.
New Mexico has seen the damage and waste caused by ISC politicized water planning that flaunted scientific integrity. ISC pursued a 4th iteration of the clearly infeasible Gila River Diversion project from 2004 until they finally stopped work in 2020. ISC modeling, public meetings, and reporting were deliberately misleading, professionally indefensible, and extremely wasteful, costing at least $16 million in federal funds and diverting many years of ISC’s limited staff resources to a boondoggle. The ISC even manipulated the Southwest New Mexico Regional Water Plan to prioritize the infeasible diversion project, causing that endeavor to be wasted, too. The Gila River Diversion Project case is the reason the 2023 Water Security Planning Act includes the bolded sentence quoted above.
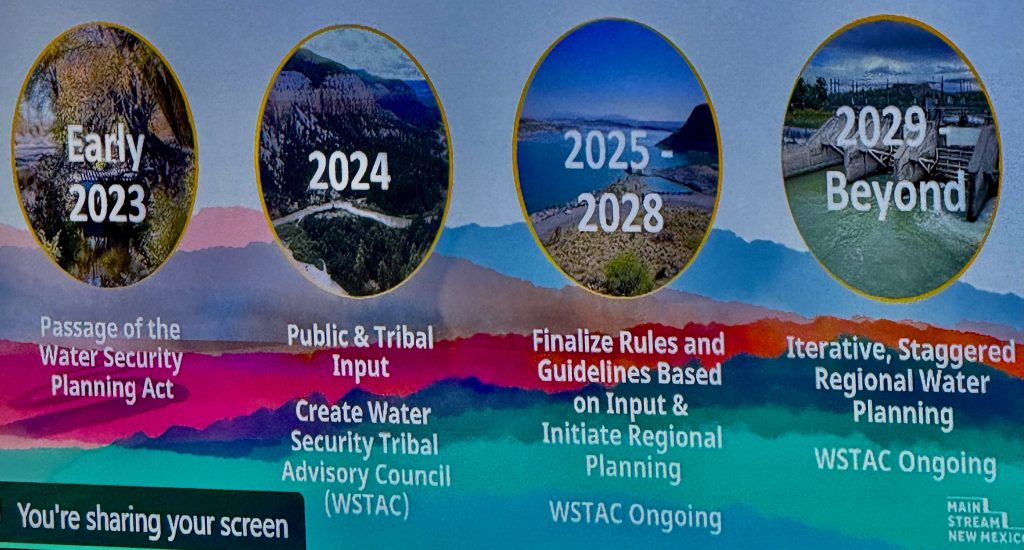
Schedule
ISC staff presented this slide to the Commission 0n June 18, 2025. The ISC planning chief’s remarks indicated staff wants to deny six of the nine regions the opportunity to participate in state funded regional water planning until 2032 or after. The staff rule is silent on the schedule, delaying that discussion for a future Commission proceeding.
ISC staff presentation to the Commission on June 18, 2025. Norm Gaume photo
A Better Path Forward: Pause, Activate, Align
Given these failings, the Commission should immediately pause its current rulemaking process. The draft rule as written cannot be the foundation for a planning program that meets legal standards, inspires public trust, empowers regions to confront their water challenges, or expands the number of minds engaged in New Mexico’s water resources problem-solving.
Instead, the Commission should adopt an interim approach using its statutory authority to fund regional activities. The Commission can and should adopt simple, short-form interim guidelines (not a full rule) to activate regional initiative through flexible early-stage grants. These guidelines would:
Allow grants to eligible fiscal agents for existing or new groups formed by regional initiative to carry out early regional organizing work;
Support activities such as convening intergovernmental forums, convening inclusive regional meetings, identifying and engaging local stakeholders, initiating council formation consistent with WSPA-mandated composition rules, or conducting preliminary needs assessments;
Require transparency and accountability through basic reporting
Allow regions to design their own path toward formal council establishment and plan development.
This approach enables planning regions to take initiative in a manner tailored to local realities—without entrenching a rigid, staff-controlled structure that predetermines the shape of regional councils or the methods of engagement. It also allows state support to flow quickly and equitably across the state, even as the formal rulemaking process is paused.
Importantly, many regional and tribal entities already possess the relationships, capacity, and readiness to engage in meaningful planning. What they lack is a legitimate framework and resourcing strategy that honors their statutory role.
The Commission should pause the rule, activate regional initiative through interim guidelines, and return to rulemaking only after real public input and on-the-ground experience.
Re-Centering the Commission’s Role
Perhaps most importantly, this alternative approach would restore the proper institutional balance between the Commission and its staff. Under the WSPA, the nine-member Interstate Stream Commission—not its staff—is the statutory deliberative and policy-making body.
The July 17, 2025, Commission meeting revealed that staff had already made key structural and policy decisions without presenting them to the Commission for public deliberation or approval. Commissioners had not been briefed on decision options. Staff had not analyzed alternatives. Staff withheld critical information from public meetings and embedded its staff-centric and centralized control policy choices in the draft rule.
Moreover, the staff-led public engagement process was inadequate. It relied heavily on dot-voting at open houses and through the mainstreamnm.org platform, which limited public learning and discouraged narrative input. While the Water Advocates and others submitted detailed written critiques, staff failed to present these to the Commission in a structured or comprehensive form. At no point did ISC staff convene a public forum where stakeholders could learn from one another or engage with subject matter experts. The process appeared designed to generate superficial evidence of consensus on simple points rather than support meaningful public input and policy guidance.
By pausing rulemaking and adopting interim guidelines, the Commission can reclaim its deliberative policymaking role and publicly structure the development of a planning program with a set of rules that meets both the letter and spirit of the WSPA.
Conclusion
The ISC staff’s proposed rule gets the Water Security Planning Act wrong in both structure and intent. It centralizes what the law seeks to decentralize. It assigns staff discretionary authority where the law assigns Commission oversight. And it fails to implement key statutory provisions that are essential to meaningful, lawful planning.
A better path is available: pause the rulemaking. Activate regional initiative through interim guidelines providing for flexible grants. Re-center the Commission’s policymaking authority. And only after sufficient on-the-ground engagement, regional mobilization, and public input, return to the rulemaking process with a foundation grounded in statute, experience, and trust. That’s how New Mexico can begin to build true water security community by community, region by region, starting now.
For legislators serious about water governance, these two presentations are essential viewing
At recent NM Water Advocates workshops, Nat Chakeres, General Counsel for the Office of the State Engineer, and Dr. Maurice Hall, an expert water resources engineer and senior advisor at the Environmental Defense Fund, delivered two of the clearest and most compelling explanations yet of New Mexico’s urgent water governance challenges—and how to address them. Click the images below to access the video recordings.
1. Nat Chakeres – State Engineer’s Strategic Approach
Chakeres, the state’s lead water attorney, argues that the time for delay is over. His key messages:
In western water management, there is no better alternative to a negotiated agreement.
Litigation is not a prerequisite to serious negotiation.
We must act now to prevent a new U.S. Supreme Court case with Texas.
The State must quantify all Middle Rio Grande water rights, including the time-immemorial rights of six Pueblos.
The state must begin active measurement and administration of diversions.
Priority Administration doesn’t work well or consider cities, hospitals, schools, homes and the sacred, the spiritual, and the living.
These water demands and other equitable claims are not going away.
Above all, New Mexico needs bold state and local leadership to manage our way out of crisis.
We don’t need another lawsuit—we need negotiated agreements, real water measurement & management, and bold leadership now.
2. Dr. Maurice Hall – Managing Aquifers as Infrastructure
Hall calls for a fundamental shift in how New Mexico manages groundwater. He explains that aquifers—natural underground formations that store and move water—must be treated as essential infrastructure. To cope with rising temperatures and shrinking water supplies, aquifers must be actively managed, not passively depleted. Hall emphasizes that building groundwater resilience requires the State to:
Invest in scientific understanding through sustained support for aquifer mapping and monitoring.
Organize and modernize water use data, including full implementation of the Water Data Act and new digital tools to track and automate water use data availability for effective balancing of supply and demand.
Delegate real authority to local leaders who are closest to the challenges and solutions.
Set enforceable statewide standards for regional water plans.
Support meaningful local control of shared water resources within a clear and accountable statewide framework.
“Resilience requires local leadership, real authority, and aquifer management grounded in science—not wishful thinking.”
— Maurice Hall, Ph.D., P.E., Environmental Defense Fund
Why These Presentations Matter for Legislative Action
Together, these presentations deliver essential insights. They lay out the reasons for actions by the 2026 and 2027 Legislatures. Legislators must authorize and help New Mexico to move from overuse and inadequate information to a much more resilient and secure water future.
Legislators: watch these briefings. They offer the foundation for the water governance policy decisions New Mexico must get right before it’s too late.
As of May 2025, the U.S. Drought Monitor shows that Albuquerque is gripped by Drought Stage D3—Extreme Drought. Nearly 97% of Bernalillo County is in the same condition, along with most of New Mexico’s Rio Grande Basin.
Yet, the Albuquerque Bernalillo County Water Utility Authority says we’re in Drought Stage D0—a designation that, in the Authority’s framework, means customers are conserving more water than the utility’s target. This internal metric, however, is not a hydrologic drought indicator. It contradicts observable realities and misleads the public.
This disconnect matters. The Authority is heavily pumping groundwater to meet demand. The Middle Rio Grande’s surface water is already over-allocated, and vast stretches of the river from Elephant Butte to Albuquerque will likely be dry this summer. Despite this, the utility tells customers there’s no cause for concern.
Two slides below are copied from a water resources presentation posted for the May 21 Water Authority Board meeting. They show that the utility’s definitions are decoupled from actual drought conditions, such as those recognized by federal agencies.
At the same meeting, the Board adopted its FY2026 budget. Discussion revealed that customer conservation is reducing utility revenue, threatening the Water Authority’s ability to meet debt service and annual operating costs.
So what does the utility do? It downplays the drought. Never mind that:
Middle Rio Grande water users are consuming water legally allocated to downstream users under the Rio Grande Compact,
Without urgent state action, the region’s cumulative water debt could exceed the Compact’s legal limit this year or next, subjecting New Mexico’s water management to judicial discretion.
From the Water Advocates’ perspective, the problem is deeper than misleading messaging. No one is taking effective charge. No public agencies are acting with the urgency that increasing aridity coupled with extreme drought conditions demand.
The Water Authority undermines its own credibility — and fails its customers and the region’s economy — by using internally defined drought stages that obscure reality rather than reflect it. We urge the Authority to adopt transparent, science-based drought metrics and to communicate honestly with the public about the very real risks we all face.


